
In my research on strain wave gear reducers, commonly known as harmonic gear drives, I have focused on developing a comprehensive virtual testing system to evaluate their critical performance parameters. Strain wave gear technology, based on elastic deformation theory, offers unique advantages such as compact size, high reduction ratios, and precision, making it indispensable in aerospace, robotics, and instrumentation. However, assessing its technical indicators under various conditions poses significant challenges. To address this, I leveraged virtual instrument technology, which emphasizes software-defined functionality, to create a flexible and cost-effective testing platform. This system enables detailed analysis of torque, speed, efficiency, transmission accuracy, noise, temperature rise, and vibration, providing valuable data for optimizing strain wave gear design and application.
The core of my work involves designing a virtual testing system that integrates hardware components with software algorithms developed in LabVIEW 2009. By utilizing virtual instruments, I aimed to reduce hardware costs while enhancing data processing capabilities. This approach allows for real-time signal acquisition, analysis, and visualization, facilitating a thorough evaluation of strain wave gear reducers. In this article, I will detail the testing principles, methods, and system design, emphasizing the use of formulas and tables to summarize key aspects. The strain wave gear, with its reliance on flexible components to generate elastic mechanical waves, requires precise measurement techniques to ensure reliable performance in demanding environments.
To begin, I explored the fundamental parameters necessary for assessing strain wave gear reducers. These include mechanical efficiency, noise, temperature rise, transmission accuracy, and vibration. Each parameter requires specific testing principles and methods, which I implemented using sensors, data acquisition cards, and motion control cards. The virtual testing system I designed not only measures these parameters but also analyzes the data to identify trends and anomalies. For instance, in efficiency testing, I synchronized torque and speed measurements to calculate power input and output accurately. The strain wave gear’s efficiency is critical for applications where energy conservation and heat management are paramount. By employing virtual instruments, I could customize the testing procedures to match different strain wave gear models and operating conditions.
One of the primary parameters I tested is mechanical efficiency. The efficiency of a strain wave gear reducer reflects its ability to transmit power with minimal losses. I derived the testing principle from basic electromechanical formulas. The power (P) in kilowatts can be calculated using torque (T) in Newton-meters and speed (n) in revolutions per minute (rpm):
$$ P = \frac{T \times n}{9549} $$
In practice, the testing setup includes couplings between the sensors and the strain wave gear reducer, which introduce efficiency losses. Therefore, the input power (P_in) and output power (P_out) are adjusted as follows:
$$ P_{\text{in}} = \frac{T_{\text{in}} \times n_{\text{in}}}{9549} \times \eta_l $$
$$ P_{\text{out}} = \frac{T_{\text{out}} \times n_{\text{out}}}{9549} \div \eta_l $$
where η_l represents the coupling efficiency. The overall efficiency (η) of the strain wave gear reducer is then:
$$ \eta = \frac{P_{\text{out}}}{P_{\text{in}}} = \frac{T_{\text{out}} \times n_{\text{out}}}{T_{\text{in}} \times n_{\text{in}}} \times \frac{1}{\eta_l^2} $$
To measure torque, I used strain-gauge-based torque sensors that convert mechanical deformation into electrical signals. For speed measurement, I employed optical encoders with 2048 pulses per revolution, allowing precise frequency or period-based calculations depending on the speed range. The data from these sensors were acquired via data acquisition cards and processed in LabVIEW to compute efficiency in real-time. This method ensures accurate evaluation of the strain wave gear’s performance under various load conditions.
Another key aspect is noise testing. Excessive noise in a strain wave gear reducer can indicate wear or misalignment, affecting its suitability for quiet environments like medical devices or satellites. I followed standard guidelines, such as GB6404, by placing a sound level meter one meter from the reducer housing. The system operates at rated speed and load, and the maximum noise level is recorded. The virtual testing system I designed automates this process, capturing audio data and analyzing it to ensure the strain wave gear meets the requirement of not exceeding 60 dB. This integration highlights the flexibility of virtual instruments in handling diverse measurement tasks.
Temperature rise is also crucial for strain wave gear reducers, especially in extreme environments ranging from -40°C to +55°C. I used thermistors attached to the reducer housing and the environmental chamber to monitor temperatures. The data acquisition card collects voltage signals from the thermistors, which are then converted to temperature values through calibration in LabVIEW. The temperature rise (ΔT) is calculated as the difference between the reducer temperature and the ambient temperature:
$$ \Delta T = T_{\text{reducer}} – T_{\text{ambient}} $$
The virtual testing system records real-time waveforms, average values, and peak temperatures. For validation, the strain wave gear must start unloaded at -40°C after two hours and operate at rated conditions at +55°C without exceeding a 45°C rise (100°C maximum). This testing ensures the strain wave gear’s reliability in thermal stress scenarios.
Transmission accuracy, which refers to the deviation between theoretical and actual angular positions, is vital for precision applications like robotics. I measured this using encoders on both the input and output shafts. The transmission error (ε) is defined as:
$$ \epsilon = \theta_{\text{theoretical}} – \theta_{\text{actual}} $$
where θ represents angular position. The input angle is obtained from the drive motor’s encoder, while the output angle comes from the load simulator’s encoder. To simulate realistic loads, I combined a magnetic powder brake for high-torque loading and a torque motor for fine control, achieving a loading accuracy of 0.5%. The virtual testing system samples at least 720 points during operation, calculating and displaying error curves. The maximum error value indicates the transmission accuracy of the strain wave gear.
Vibration analysis provides insights into the mechanical health of the strain wave gear reducer. I installed three piezoelectric accelerometers on the reducer—vertically, horizontally, and axially—to capture multi-directional vibrations. The acquired signals are processed through integration and power spectral analysis in LabVIEW. The acceleration (a), velocity (v), and displacement (d) are derived using the following relationships:
$$ v = \int a \, dt $$
$$ d = \int v \, dt $$
Additionally, window functions are applied to reduce spectral leakage. The system outputs peak and mean values, along with waveform and power spectrum plots, helping identify resonant frequencies and vibration levels according to standards like GB2423.10.
To summarize the testing parameters and methods, I have compiled the following table, which outlines the key aspects of the virtual testing system for strain wave gear reducers:
| Testing Parameter | Principle | Method | Sensor Used | Key Formula |
|---|---|---|---|---|
| Mechanical Efficiency | Power calculation via torque and speed | Synchronized sensor data acquisition | Torque sensor, optical encoder | $$ \eta = \frac{T_{\text{out}} \times n_{\text{out}}}{T_{\text{in}} \times n_{\text{in}}} \times \frac{1}{\eta_l^2} $$ |
| Noise | Sound pressure level measurement | Sound level meter at 1m distance | Microphone/sound level meter | Maximum level ≤ 60 dB |
| Temperature Rise | Thermal difference monitoring | Thermistors on housing and environment | Thermistor | $$ \Delta T = T_{\text{reducer}} – T_{\text{ambient}} $$ |
| Transmission Accuracy | Angular error between input and output | Encoder-based position tracking | Optical encoder | $$ \epsilon = \theta_{\text{theoretical}} – \theta_{\text{actual}} $$ |
| Vibration | Acceleration measurement and integration | Multi-axis accelerometer placement | Piezoelectric accelerometer | $$ v = \int a \, dt, \quad d = \int v \, dt $$ |
Building on these testing principles, I designed the hardware and software components of the virtual testing system. The hardware setup includes a drive motor, input and output torque sensors, the strain wave gear reducer under test, a load simulator (combining a magnetic powder brake and torque motor), data acquisition cards, motion control cards, and an industrial computer. For efficiency testing, both torque sensors are used, whereas for transmission accuracy testing, only the output torque sensor is necessary to minimize interference. This modular design allows quick reconfiguration for different tests, enhancing the system’s versatility for various strain wave gear models.
The software development was carried out in LabVIEW 2009, utilizing its graphical programming environment to create a user-friendly interface. The software integrates motion control, data acquisition, and analysis algorithms. I designed a flowchart-based structure to streamline testing procedures: first, initialize system parameters such as reducer model and gear ratio; second, configure motor speeds and load settings; third, start data acquisition and real-time monitoring; fourth, process signals to compute parameters like efficiency and error; and finally, display results through graphs and numerical indicators. The front panel of the virtual testing system includes controls for setting test conditions and indicators for output data, enabling interactive operation. By leveraging virtual instrument technology, I minimized hardware dependencies, as software routines handle complex calculations such as Fast Fourier Transforms (FFT) for vibration analysis or digital filtering for noise reduction.
To further illustrate the system’s capabilities, I developed additional formulas for advanced analysis. For example, in vibration testing, the power spectral density (PSD) is calculated to identify frequency components:
$$ \text{PSD}(f) = \lim_{T \to \infty} \frac{1}{T} \left| \int_{-T/2}^{T/2} x(t) e^{-i2\pi ft} dt \right|^2 $$
where x(t) is the acceleration signal and f is frequency. This helps in pinpointing specific vibration sources within the strain wave gear reducer. Similarly, for transmission accuracy, I implemented statistical methods to compute the standard deviation of error over multiple cycles:
$$ \sigma_\epsilon = \sqrt{\frac{1}{N} \sum_{i=1}^{N} (\epsilon_i – \bar{\epsilon})^2 } $$
where N is the number of samples and \(\bar{\epsilon}\) is the mean error. These analyses provide deeper insights into the performance consistency of the strain wave gear.
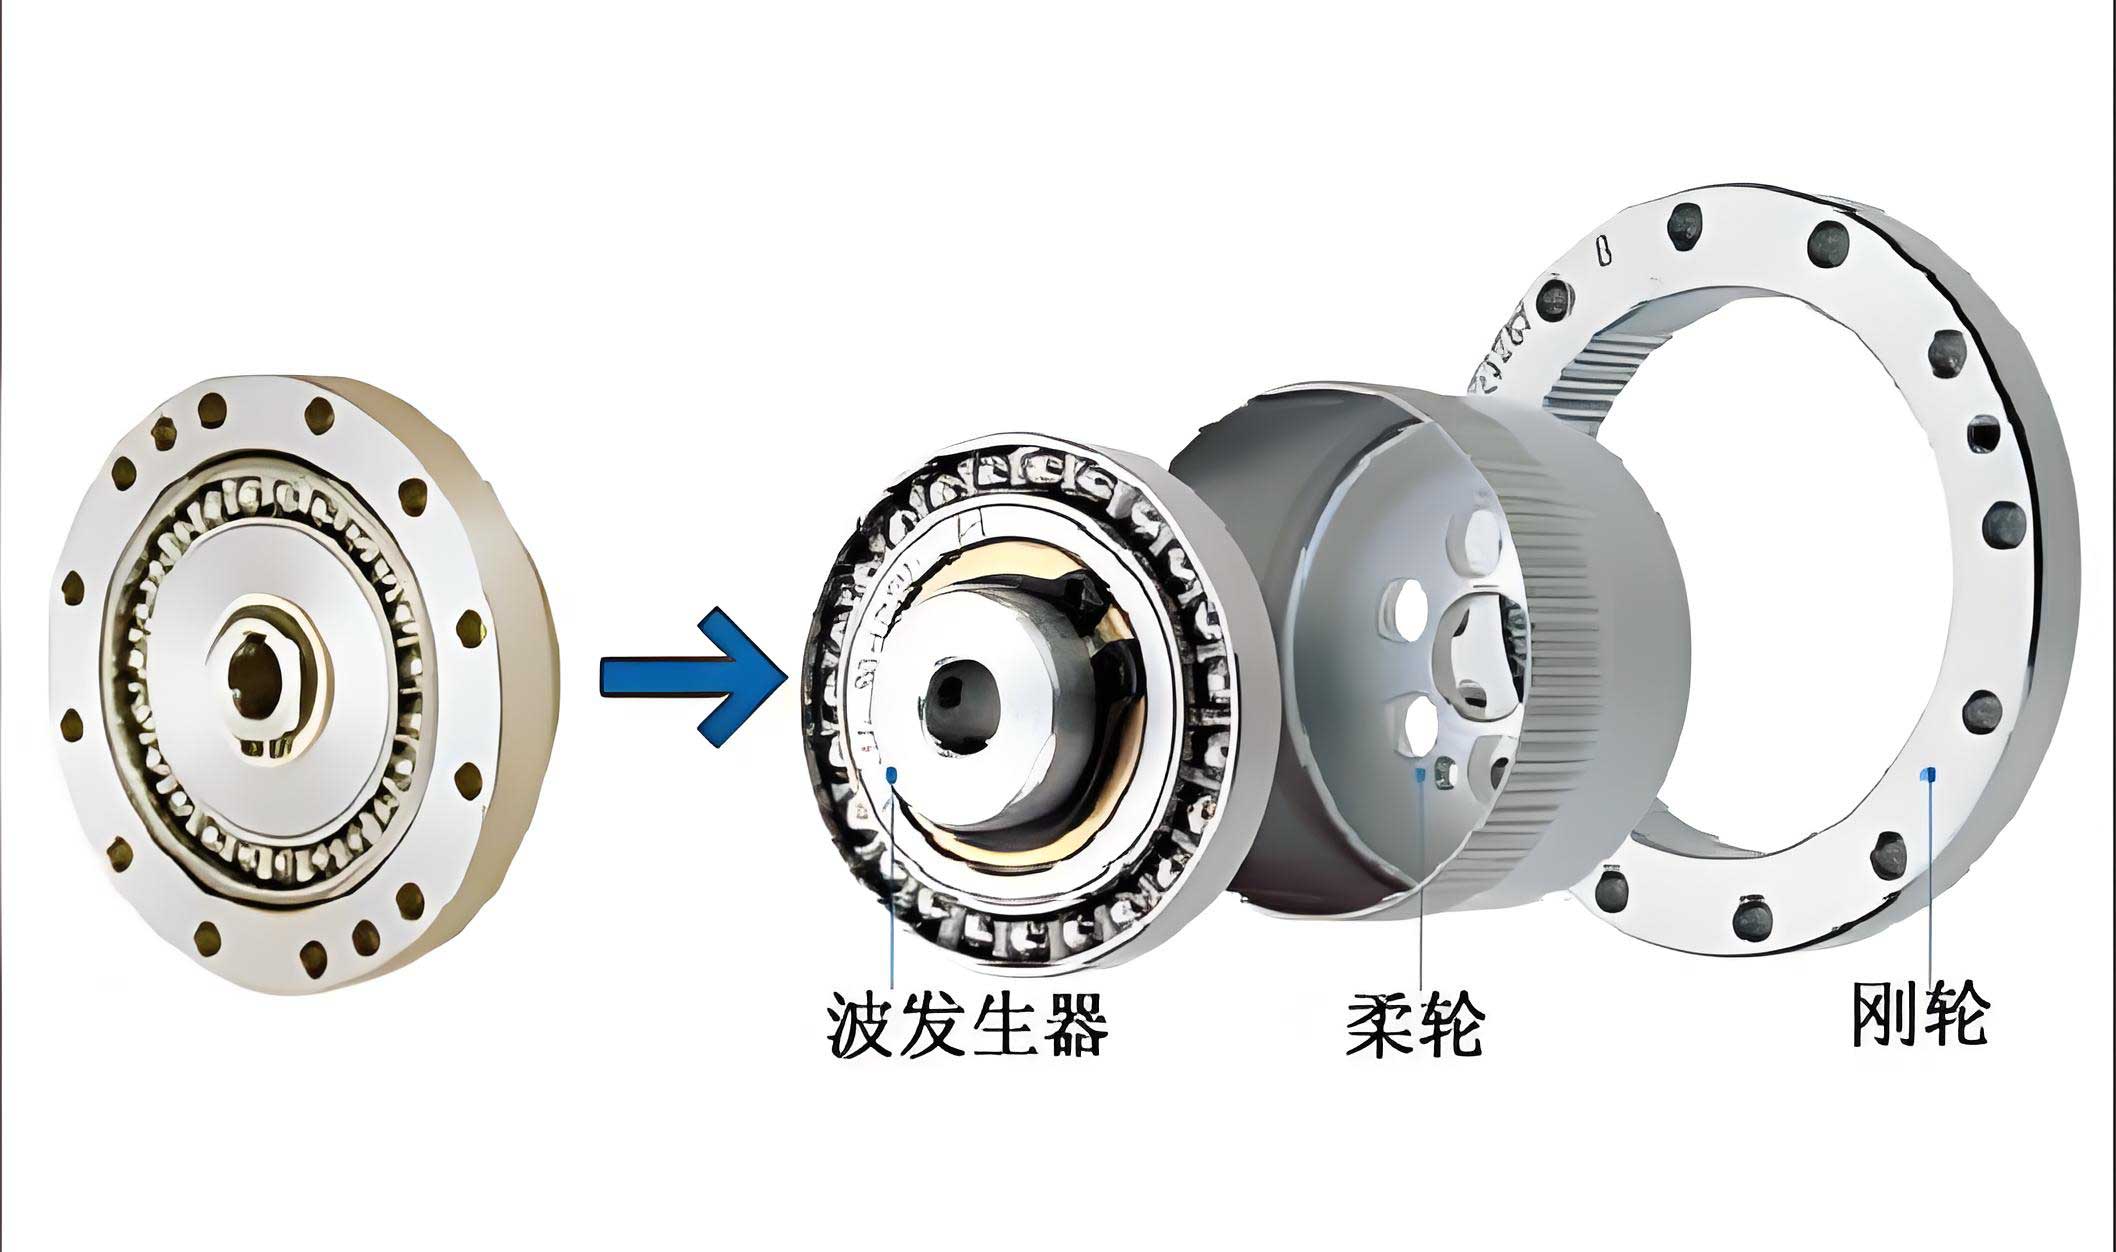
The virtual testing system also incorporates data management features, allowing storage of test results in databases for trend analysis and comparative studies. This is particularly useful for long-term reliability assessments of strain wave gear reducers in field applications. By automating report generation, the system reduces manual effort and ensures accuracy. In my experiments, I validated the system using multiple strain wave gear units, confirming that it meets industry standards for precision and repeatability. The strain wave gear’s unique design, which involves a flexible spline and wave generator, requires such comprehensive testing to ensure optimal functionality in critical systems like satellite antennas or robotic joints.
In terms of hardware selection, I carefully chose sensors with high accuracy and compatibility. For torque measurement, I used non-contact rotary torque sensors with strain bridges, offering ranges suitable for different strain wave gear sizes. The optical encoders provide high-resolution position feedback, essential for capturing minute angular deviations. The data acquisition cards support multiple channels for simultaneous sampling of torque, temperature, and vibration signals, while the motion control card ensures precise motor control for speed and load variations. This integrated hardware-software approach exemplifies the power of virtual instruments in modern engineering testing.
To enhance the testing process, I added calibration routines within the software. For instance, torque sensors are calibrated using known weights and lever arms, with the relationship:
$$ T = F \times r $$
where F is force and r is radius. The calibration data is stored and applied automatically during tests, improving measurement accuracy for the strain wave gear reducers. Similarly, thermistors are calibrated against reference temperature sources to account for non-linearities. These features make the virtual testing system robust and adaptable to various laboratory conditions.
Another aspect I considered is the system’s scalability. The virtual testing system can be extended to include additional parameters, such as backlash or lifetime testing, by integrating more sensors or modifying the software algorithms. This flexibility is a key advantage of using LabVIEW, as it supports modular programming and third-party toolkits. For strain wave gear manufacturers, this means a single platform can evolve with product development cycles, reducing overall testing costs and time-to-market.
In conclusion, my research on the virtual testing system for strain wave gear reducers demonstrates the effectiveness of virtual instrument technology in performance evaluation. By combining precise hardware with sophisticated software, I created a system that accurately measures torque, speed, efficiency, noise, temperature rise, transmission accuracy, and vibration. The strain wave gear, with its complex wave-like motion, benefits from such detailed analysis to ensure reliability in demanding applications. The use of formulas and tables, as shown throughout this article, helps summarize key testing principles and results. The virtual testing system not only reduces hardware investment but also enhances data processing capabilities, making it a valuable tool for optimizing strain wave gear design and quality control. Future work may involve integrating artificial intelligence for predictive maintenance or expanding the system for other gear types, but the core principles established here provide a solid foundation for advanced mechanical testing.
The strain wave gear reducer, through this virtual testing approach, can achieve higher performance standards, contributing to advancements in fields like aerospace and robotics. My experience with this system underscores the importance of software-driven solutions in modern engineering, where adaptability and precision are paramount. As strain wave gear technology continues to evolve, such testing systems will play a crucial role in pushing the boundaries of mechanical transmission systems.