
In the realm of industrial robotics, precision transmission components are critical for ensuring accurate and reliable motion control. Among these, the rotary vector reducer stands out as a key component due to its high torque capacity, compact design, and exceptional backlash performance. The return difference, often referred to as backlash or hysteresis error, is a pivotal metric that quantifies the lag in output motion when the input direction reverses. This parameter directly impacts the positional accuracy and repeatability of robotic systems, making its measurement essential for quality assurance and performance evaluation. Typically, industrial-grade rotary vector reducers require a return difference maintained within 1 to 1.5 arcminutes to meet stringent operational standards. This article delves into the methodologies for testing return difference in rotary vector reducers, leveraging a comprehensive performance testing platform. By examining the entire loading process and analyzing data through advanced software, we aim to establish a robust and scientific testing approach that enhances the evaluation of rotary vector reducer transmission precision.
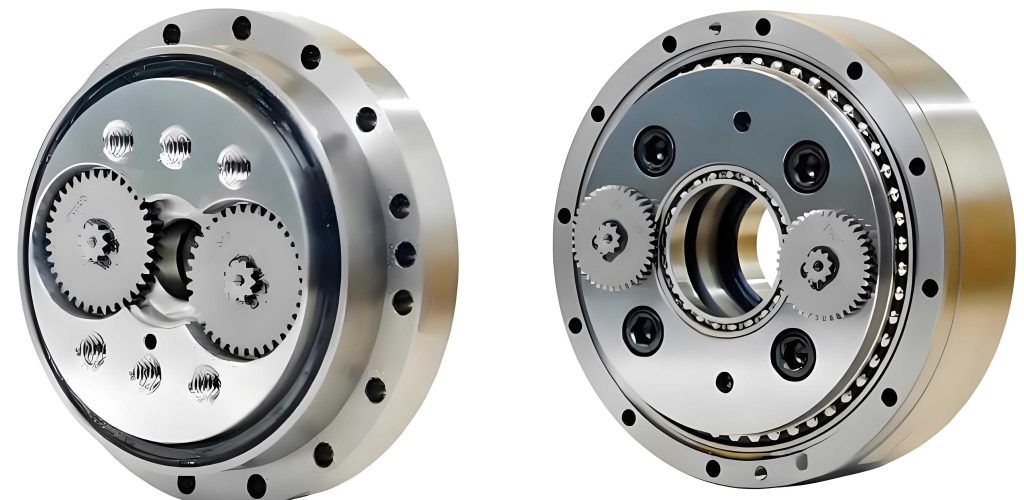
The rotary vector reducer, a type of precision speed reducer, integrates cycloidal and planetary gear mechanisms to achieve high reduction ratios and minimal backlash. Its design minimizes mechanical play, but inherent factors such as gear tooth clearance, bearing tolerances, and assembly variations contribute to return difference. This error manifests as a delay in output response during input reversal, which can lead to positioning inaccuracies in applications like robotic arms, CNC machinery, and aerospace actuators. Accurate measurement of return difference is thus paramount for validating the performance of rotary vector reducers, especially in high-precision industries. Traditional testing methods often involve manual or semi-automated techniques that may lack consistency, highlighting the need for an integrated, automated testing platform. This research focuses on developing a systematic test method that not only quantifies return difference but also provides insights into other performance metrics like transmission error, torsional stiffness, and efficiency, ensuring a holistic assessment of rotary vector reducer functionality.
To facilitate comprehensive testing, a dedicated performance evaluation platform for rotary vector reducers was designed and implemented. This platform comprises three core subsystems: the mechanical system, the measurement and control system, and the software system. Each subsystem is engineered to work in harmony, enabling precise data acquisition and analysis. The mechanical system forms the physical foundation, consisting of a robust base frame, motor and reducer mounting supports, input and output modules, sensor integration units, and an adjustable platform for alignment. Key components include servo motors for input drive, torque sensors for load measurement, and high-resolution rotary encoders (circular gratings) for angular displacement tracking. The measurement and control system orchestrates the test procedures through a combination of motion controllers, drivers, data acquisition cards, and signal conditioners. For instance, a servo motor controls the input shaft rotation, while a magnetic powder brake applies controlled torque to the output shaft, simulating real-world loading conditions. The software system, developed in-house, provides a user-friendly interface for parameter configuration, real-time monitoring, data processing, and report generation. It integrates modules for data management, test sequencing, and analytical tools to compute performance indices. This integrated approach ensures that the rotary vector reducer is evaluated under consistent and repeatable conditions, minimizing human error and enhancing test reliability.
The mechanical system of the testing platform is meticulously crafted to ensure stability and precision. The base frame is constructed from high-strength materials to dampen vibrations and maintain alignment during dynamic tests. The input module incorporates a servo motor coupled to the rotary vector reducer via a flexible coupling, allowing for smooth torque transmission and misalignment compensation. The output module features a magnetic powder brake that can lock the output shaft or apply variable torque, enabling tests like torsional stiffness and return difference. Sensors are strategically placed: a torque sensor on the output side measures applied load, while circular grating encoders on both input and output shafts capture angular positions with resolutions as fine as 0.01 arcseconds. These encoders are critical for detecting minute displacements that characterize return difference in rotary vector reducers. The adjustable platform allows for fine-tuning of component positions to achieve optimal coaxiality, which is essential for reducing measurement artifacts. Table 1 summarizes the key parameters of major components used in the platform, highlighting their roles in ensuring accurate testing of rotary vector reducer performance.
| Component | Model/Type | Specifications | Function |
|---|---|---|---|
| Torque Sensor | YH502 | Range: ±5000 N·m, Output: 5–15 kHz, Power: ±15 VDC | Measures output torque during loading/unloading cycles |
| Circular Grating Encoder | RGH20D | Accuracy: ±0.5 arcseconds, Resolution: 0.01 arcseconds | Captures input and output shaft angular positions |
| Magnetic Powder Brake | CZ5000J/Y | Rated Voltage: 220 V, Slip Power: 40 kW | Applies and controls load on output shaft |
| Servo Motor | AM8000 | Stall Torque: 21.2 N·m, Rated Speed: 3000 rpm | Drives input shaft for motion simulation |
| Data Acquisition Card | DSI Series | High-speed sampling, Multi-channel input | Collects sensor data for real-time processing |
The measurement and control system is the nerve center of the testing platform. It employs a closed-loop architecture where the software sends commands to the servo motor and magnetic powder brake via controllers and drivers. During tests, the system synchronizes data acquisition from torque sensors and encoders using a data acquisition card (e.g., DSI card) and signal dividers. This ensures that torque and angle measurements are timestamped and correlated for accurate analysis. For instance, in return difference testing, the magnetic powder brake locks the output shaft, while the servo motor applies incremental torque to the input shaft. At each torque step, the circular grating encoder on the input shaft records the corresponding angular displacement, which is fed into the software for hysteresis curve plotting. The system’s robustness allows for testing under various conditions, such as different load levels and temperatures, to evaluate the rotary vector reducer’s performance across operational ranges. Additionally, the platform supports automated test sequences, reducing manual intervention and enhancing repeatability. By integrating these subsystems, the testing platform provides a versatile environment for comprehensive evaluation of rotary vector reducers, including their return difference, transmission error, torsional stiffness, and efficiency.
Transmission error is another critical parameter for rotary vector reducers, defined as the deviation between the actual output rotation and the theoretically expected output based on the input rotation and gear ratio. The testing platform measures this by driving the input shaft with the servo motor while applying a constant load via the magnetic powder brake. The circular grating encoders on both shafts capture real-time angular positions, and the software computes the transmission error using the formula: $$ \Delta \phi = \theta_{\text{out}} – \frac{\theta_{\text{in}}}{i} $$ where \(\Delta \phi\) is the instantaneous transmission error, \(\theta_{\text{out}}\) is the actual output angle, \(\theta_{\text{in}}\) is the actual input angle, and \(i\) is the theoretical transmission ratio of the rotary vector reducer. This metric reflects the kinematic accuracy of the reducer under load, which is vital for applications requiring precise motion synchronization. Similarly, torsional stiffness is assessed by gradually applying torque to the output shaft while keeping the input shaft stationary. The output angle and torque are recorded, and stiffness is calculated as: $$ T = \frac{b}{a} $$ where \(T\) represents torsional stiffness, \(b\) is the applied torque, and \(a\) is the angular deflection at the output. This indicates the rotary vector reducer’s resistance to deformation under load, influencing its dynamic response. Efficiency testing involves measuring input and output power using torque and speed sensors, with efficiency given by: $$ \eta = \frac{P_{\text{out}} \times i}{P_{\text{in}}} $$ where \(\eta\) is the transmission efficiency, \(P_{\text{out}}\) is output power, and \(P_{\text{in}}\) is input power. These complementary tests provide a holistic view of the rotary vector reducer’s performance, with return difference being a focal point due to its impact on positional accuracy.
The return difference testing method employed in this study is based on a progressive loading approach, which is widely recognized for its accuracy in quantifying backlash. The procedure begins by securely mounting the rotary vector reducer on the testing platform and ensuring proper alignment. The output shaft is locked using the magnetic powder brake, simulating a fixed load condition. A servo motor then applies torque to the input shaft in a controlled manner: starting from zero, the torque is gradually increased to a positive rated value (e.g., +M), then decreased back to zero. This constitutes the forward loading cycle. Subsequently, the torque is applied in the negative direction, increasing to -M and then returning to zero, forming the reverse loading cycle. Throughout these cycles, at each torque increment or decrement, the circular grating encoder on the input shaft measures the corresponding angular displacement. The data points (torque vs. angle) are recorded and transmitted to the upper computer software for processing. The software plots these points to generate a hysteresis curve, which visually represents the lag between loading and unloading paths. The return difference is derived from this curve as the horizontal intercept difference at zero torque. Mathematically, if the hysteresis curve intersects the angle axis at points \(y_1\) and \(y_2\) for forward and reverse cycles, the return difference \(\Delta \varphi\) is calculated as: $$ \Delta \varphi = y_1 – y_2 $$ This value, typically expressed in arcminutes or arcseconds, quantifies the backlash inherent in the rotary vector reducer. The testing process is automated to ensure consistency, with multiple cycles performed to average out variations and improve measurement reliability. Figure 1 illustrates the schematic of the return difference test setup, highlighting the interaction between components.
To validate the testing method, a series of experiments were conducted on prototype rotary vector reducers and a commercially available unit for comparison. Two self-developed rotary vector reducer samples (designated as Sample 1 and Sample 2) with a model similar to RV-20E-105 were tested alongside a counterpart from a leading manufacturer (referred to as Brand T). Each reducer underwent multiple return difference tests to account for statistical variability, and the results were averaged to enhance accuracy. The testing software automatically computed the return difference for each run, and the data was compiled for analysis. The hysteresis curves for the samples exhibited characteristic loops, with the width indicating the magnitude of return difference. For instance, Sample 1 showed a curve with intercepts yielding a return difference range, while Sample 2 displayed slightly broader loops, suggesting higher backlash. The commercial unit demonstrated tighter loops, reflecting superior precision. The results are summarized in Table 2, which presents the maximum, minimum, and average return difference values in arcminutes. This comparative analysis allows for assessing the performance of the self-developed rotary vector reducers against industry benchmarks.
| Rotary Vector Reducer Sample | Maximum Return Difference (arcminutes) | Minimum Return Difference (arcminutes) | Average Return Difference (arcminutes) |
|---|---|---|---|
| Self-Developed Sample 1 (RV-20E-105) | 2.32 | 1.07 | 1.77 |
| Self-Developed Sample 2 (RV-20E-105) | 2.62 | 1.11 | 1.80 |
| Commercial Brand T (RV-20E-105) | 2.15 | 0.82 | 1.44 |
The analysis of test results reveals that the self-developed rotary vector reducers exhibit return difference values slightly higher than those of the commercial unit, but within acceptable margins for many applications. The average return difference for Sample 1 is 1.77 arcminutes, and for Sample 2, it is 1.80 arcminutes, compared to 1.44 arcminutes for Brand T. This indicates that while there is room for improvement in manufacturing tolerances and assembly techniques, the prototypes perform reasonably well. The variation in maximum and minimum values across tests underscores the importance of multiple measurements to capture the inherent variability in rotary vector reducer behavior. Factors such as lubrication, temperature, and initial wear can influence return difference, so the testing platform includes environmental controls to minimize these effects. By comparing the hysteresis curves, we can also infer the linearity and consistency of the reducers; for example, a smoother curve suggests more predictable performance. The testing method’s effectiveness is further validated by the clear distinction between samples, demonstrating its sensitivity to detect differences in rotary vector reducer quality. This approach not only quantifies return difference but also provides diagnostic insights, such as identifying sources of excessive backlash (e.g., gear mesh issues or bearing play) through curve shape analysis.
In addition to return difference, the testing platform enables comprehensive evaluation of other performance metrics that are interrelated. For instance, transmission error and return difference often correlate, as both are influenced by gear geometry and clearance. By conducting simultaneous tests, we can derive relationships that inform design improvements. The software system facilitates this by integrating data from all sensors and generating combined reports. For example, during return difference testing, the input shaft angle data can be used to compute angular stiffness variations, providing a multi-faceted view of rotary vector reducer dynamics. Moreover, the platform supports fatigue testing by cycling the reducer through numerous load reversals, monitoring how return difference evolves over time—a key consideration for longevity in robotic applications. The use of high-resolution encoders ensures that even minute changes are detectable, which is crucial for premium-grade rotary vector reducers where backlash must be minimized. The automation of test sequences reduces operator dependency, making the method scalable for production-line quality control. Overall, this holistic testing framework advances the state-of-the-art in rotary vector reducer assessment, moving beyond single-parameter checks to a systems-level approach that mirrors real-world operating conditions.
The software system plays a pivotal role in streamlining the testing process and enhancing data accuracy. Developed using modular architecture, it comprises four main modules: data management, parameter configuration, measurement and analysis, and user management. The data management module handles storage and retrieval of test results, allowing for historical comparison and trend analysis. The parameter configuration module enables users to set test parameters such as torque range, step size, and cycle count, tailored to specific rotary vector reducer models. The measurement and analysis module is the core, where real-time data from sensors is processed to compute performance indices like return difference. It includes algorithms for filtering noise, calibrating sensors, and generating hysteresis curves. For return difference, the software automatically identifies the intercept points on the angle axis using curve-fitting techniques, ensuring objective and repeatable calculations. The user management module controls access privileges, maintaining data integrity. The interface is designed for intuitiveness, with graphical displays of torque-angle plots and tabular results. This software integration not only automates calculations but also reduces human error, making the testing method scientifically robust. By leveraging this system, manufacturers of rotary vector reducers can consistently evaluate products and implement corrective actions based on quantitative data.
Looking forward, the testing method can be enhanced with advanced features such as artificial intelligence for predictive maintenance and anomaly detection. For example, machine learning algorithms could analyze hysteresis curves to identify early signs of wear in rotary vector reducers, enabling proactive replacements. Additionally, the platform could be adapted for testing under extreme conditions, such as high temperatures or vacuum environments, to simulate space or industrial furnace applications. The methodology also opens avenues for standardizing return difference measurement across the industry, potentially leading to international testing protocols for rotary vector reducers. Furthermore, integrating wireless sensors could enable remote monitoring and testing, facilitating decentralized quality assurance. As rotary vector reducers evolve with new materials and designs, the testing platform must evolve accordingly, perhaps incorporating non-contact measurement techniques like laser interferometry for even higher precision. These advancements will ensure that the testing method remains relevant and effective for future generations of rotary vector reducers, supporting innovation in robotics and automation.
In conclusion, this research presents a comprehensive and scientifically validated method for testing return difference in rotary vector reducers. By developing an integrated performance testing platform, we have demonstrated a systematic approach that combines mechanical precision, advanced measurement and control, and sophisticated software analysis. The method involves progressive loading and unloading cycles, with real-time data acquisition from high-resolution encoders and torque sensors, culminating in hysteresis curve plotting and return difference calculation. Experimental results on self-developed and commercial rotary vector reducers show that the method effectively discriminates between units, with the self-developed samples exhibiting slightly higher return difference but still within practical limits. The comparative analysis confirms the method’s scientific validity and effectiveness, providing a reliable tool for quality assessment. This work contributes to the broader field of precision engineering by offering a robust framework for evaluating rotary vector reducer performance, ultimately aiding in the advancement of high-accuracy robotic systems. Future efforts will focus on refining the platform for broader applications and incorporating predictive analytics to further enhance the testing of rotary vector reducers.