
The pursuit of high-precision motion control in industrial automation, particularly in robotic arms, has placed stringent demands on power transmission components. Among these, the Rotate Vector (RV) reducer stands out due to its compact design, high reduction ratio, substantial load capacity, and exceptional positional accuracy. The transmission accuracy of an RV reducer, defined as the deviation between the theoretical and actual output rotation for a given input, is paramount for the overall performance of robotic systems. This accuracy is not a static property but a dynamic characteristic influenced by a complex interplay of nonlinear factors inherent in its manufacturing and assembly. This article delves into a comprehensive analysis of the nonlinear dynamic transmission accuracy of RV reducers, establishing a sophisticated dynamics model, performing detailed numerical simulations to isolate and understand key error sources, and validating the theoretical findings with experimental data.
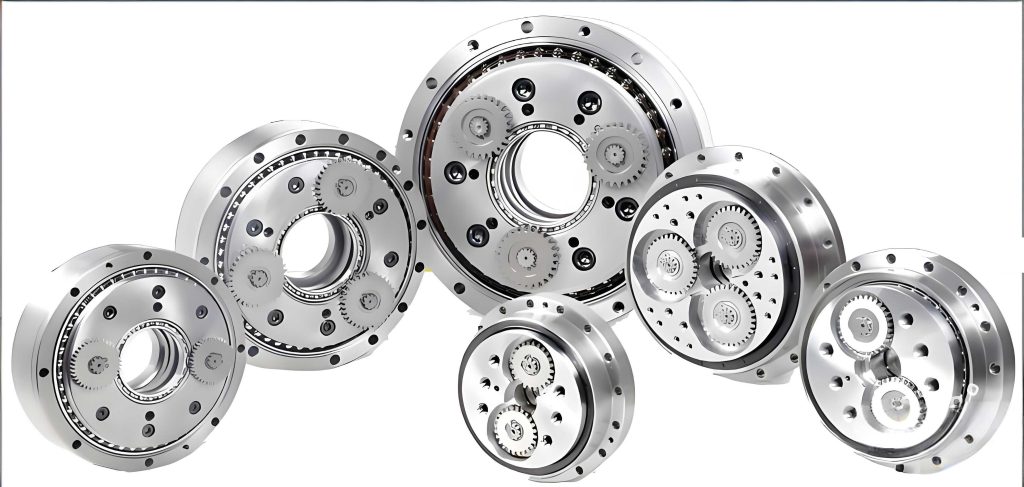
The operational principle of a typical RV reducer involves a two-stage power transmission system. The first stage is a conventional involute planetary gear train located at the high-speed input side. It consists of a sun gear, multiple planetary gears (typically two or three), and a fixed ring gear, providing the initial speed reduction. The second stage, which is the core of the RV reducer and contributes most significantly to its high reduction ratio and rigidity, is a cycloid-pin wheel planetary mechanism. In this stage, the planetary carrier from the first stage drives several crankshafts (typically two or three, phase-shifted by 120°). Each crankshaft has an eccentric section that engages with a cycloid gear via a rotating arm bearing. Two cycloid gears, often with a 180° phase difference between their teeth, mesh with a stationary ring of pins housed in the pin wheel (or pin housing). The slightly different tooth count between the cycloid gear and the pin wheel generates the precise, high-ratio reduction. The output is taken from the planetary carrier of this cycloid stage, which is connected to the output flange. The compact and robust nature of this dual-stage RV reducer design makes it indispensable for precision applications.
Analyzing the dynamic performance of an RV reducer requires moving beyond static or kinematic models. A dynamic model that accounts for time-varying forces, component flexibilities, and, most critically, various sources of error is essential. This study employs a “mass-spring equivalent model” approach to construct a nonlinear dynamic model for predicting the transmission accuracy of the RV reducer. In this model, key components like gears, shafts, and bearings are represented by concentrated masses and interconnected by nonlinear spring elements that simulate contact stiffnesses, support stiffnesses, and, crucially, the effects of errors and clearances.
The generalized coordinates of the system describe the micro-displacements of each component from their ideal theoretical positions. For the first (involute) stage, these include the translational and rotational micro-displacements of the sun gear (\(X_s, Y_s, \theta_s\)) and each planetary gear (\(X_{pi}, Y_{pi}, \theta_{pi}\)). For the second (cycloid) stage, coordinates define the motion of each cycloid gear (\(\eta_j, \theta_{dj}\)), the planetary carrier/output flange (\(X_{ca}, Y_{ca}, \theta_{ca}\)), and the crankshafts. The connecting stiffnesses are critical parameters: \(K_s\) for the input shaft torsion, \(K_i\) for the sun-planet mesh, \(K_j\) for the rotating arm bearing between the crankshaft eccentric and the cycloid gear bore, \(K_b\) for the crankshaft support bearing in the planetary carrier, \(K_{jk}\) for the cycloid gear tooth and pin contact, and \(K_{ca}\) for the support bearing of the output flange. The nonlinearity is introduced through the representation of errors. These are modeled as equivalent displacements at the contact points. Major error sources considered include manufacturing errors (e.g., profile error \(\delta_b\), pitch deviation \(\Delta p\), pin diameter error \(\delta_{jb}\)), assembly errors (e.g., eccentricity errors of bearing bores), and operational clearances (e.g., bearing radial clearance \(\delta_{bji}\), tooth backlash \(\delta_{jk}\)). The equation of motion for the entire RV reducer system can be derived using Lagrange’s method or direct force equilibrium, leading to a complex set of second-order differential equations:
$$
\mathbf{M}\ddot{\mathbf{q}} + \mathbf{C}\dot{\mathbf{q}} + \mathbf{K}(\mathbf{q}, t)\mathbf{q} = \mathbf{F}(t) + \mathbf{F}_{error}(\mathbf{q}, t)
$$
where \(\mathbf{M}\) is the mass matrix, \(\mathbf{C}\) is the damping matrix, \(\mathbf{K}\) is the nonlinear, time-varying stiffness matrix that incorporates the meshing and bearing contact conditions, \(\mathbf{q}\) is the vector of generalized coordinates (micro-displacements), \(\mathbf{F}(t)\) is the external torque/force vector, and \(\mathbf{F}_{error}\) is the force vector arising from the equivalent error excitations. The dynamic transmission error (DTE) of the RV reducer, which is the primary output of interest, is typically defined as the difference between the actual output rotation of the flange and the theoretical output rotation based on a perfect, rigid-body kinematic ratio:
$$
\Delta \theta_{DTE}(t) = \theta_{ca, actual}(t) – \left( \frac{-Z_s}{Z_p – Z_s} \cdot \frac{1}{Z_r – Z_d} \right) \cdot \theta_s(t)
$$
where \(Z_s, Z_p\) are the tooth counts of the sun and planet gears (first stage), and \(Z_d, Z_r\) are the tooth counts of the cycloid disk and pin wheel (second stage). The negative sign accounts for the direction of rotation. Solving this system of equations numerically (e.g., using the Runge-Kutta method) under steady-state operating conditions yields the time history of the DTE.
For the purpose of this analysis, an RV-80E type reducer is selected. Its fundamental geometric and design parameters form the basis for the numerical simulation. These parameters are summarized in the table below.
| Transmission Stage | Parameter Name | Value |
|---|---|---|
| First Stage (Involute Planetary) | Sun Gear Teeth (\(Z_s\)) | 14 |
| Planet Gear Teeth (\(Z_p\)) | 28 | |
| Gear Module (\(m\)) | 2.5 mm | |
| Pressure Angle (\(\alpha\)) | 20° | |
| Second Stage (Cycloid-Pin) | Pin Wheel Teeth (\(Z_r\)) | 40 |
| Cycloid Disk Teeth (\(Z_d\)) | 39 | |
| Pin Circle Radius (\(R_{pr}\)) | 96 mm | |
| Eccentricity (\(e\)) | 1.8 mm |
The stiffness values for the springs in the equivalent model are derived from material properties, Hertzian contact theory, and bearing catalogs. Initial error values are assigned based on manufacturing tolerance grades for precision gearing and bearings. Key initial clearances and error magnitudes are set as follows: pin-to-tooth clearance \(\delta_{jk} = 0.005\) mm, rotating arm bearing clearance \(\delta_{bji} = 0.0015\) mm, while other assembly clearances are initially assumed to be zero for baseline analysis. Specific eccentricity error patterns for the crankshaft bores in the cycloid gears and the planetary carrier are defined with magnitude and phase angle, simulating real-world imperfection distributions.
The dynamic model allows for the investigation of individual error sources, providing insight into their relative impact on the overall transmission accuracy of the RV reducer. Focusing on the cycloid stage, which is the dominant contributor to DTE, several key error types are simulated in isolation.
1. Pin Wheel Pitch Deviation: Cumulative error in the angular positioning of the pins. This creates a sinusoidal-like displacement excitation at the meshing frequency with the cycloid gear.
2. Pin Radial Position Error: Deviation of individual pins from their theoretical radius. This error directly alters the effective center distance during meshing.
3. Cycloid Gear Pitch Deviation: Cumulative error in the tooth spacing of the cycloid disk.
4. Cycloid Tooth Profile Error: Deviation of the cycloid tooth flank from its ideal theoretical profile.
The results of single-error-source simulations reveal distinct periodic patterns in the induced DTE. The pin radial position error consistently shows the largest amplitude of displacement excitation, often an order of magnitude greater than errors induced by pitch deviations or moderate profile errors. This highlights that the radial location accuracy of the pins in the pin wheel is one of the most critical manufacturing tolerances for achieving high precision in an RV reducer.
A more realistic scenario involves the coupled effect of multiple errors. The simulation is run with a comprehensive set of errors, including those from the first stage and all major errors from the second stage, simultaneously active. The resulting dynamic transmission error curve for the complete RV reducer system is complex. It exhibits a characteristic waveform with multiple superimposed frequencies. A long-period oscillation, corresponding to one full revolution of the cycloid gear (and thus the output), is observed. Superimposed on this are shorter-period fluctuations corresponding to the meshing frequency of the cycloid gear with the pins (one tooth engagement per cycle). The peak-to-peak value of the DTE under this coupled error condition is calculated. For the simulated RV-80E model with the defined error set, the maximum dynamic transmission error is found to be 42.52 arcseconds. This value falls well within the common requirement of less than 1 arcminute (60 arcseconds) for RV reducers used in industrial robots, demonstrating that even with realistic errors, the design can maintain high precision.
The assembly of the two cycloid gears onto the crankshafts presents another critical nonlinear factor. The eccentricity errors of the three crankshaft bores on each cycloid gear are not identical and have specific phase orientations. The way these error patterns on the first cycloid gear align or compensate with those on the second cycloid gear significantly affects the net excitation. An analysis is conducted by creating a scheme of typical error patterns (e.g., one bore error dominant, errors balanced at 120°, etc.) and evaluating the resulting DTE for various assembly combinations. The results are summarized in the following table, which categorizes different assembly schemes based on the relative phase of the dominant error vectors on the two cycloid gears.
| Assembly Scheme Type | Description of Error Vector Alignment | Relative Impact on Peak DTE |
|---|---|---|
| Type A: In-Phase | Dominant error vectors on both cycloids point in the same radial direction. | High (Additive effect) |
| Type B: 60° Phase Shift | Dominant error vectors are offset by 60°. | Medium-High |
| Type C: 120° Phase Shift | Dominant error vectors are offset by 120°. | Low (Optimal) |
| Type D: 180° Phase Shift (Opposed) | Dominant error vectors are directly opposite. | Medium (Partial cancellation) |
The analysis conclusively shows that the assembly scheme where the major eccentricity error vectors on the two cycloid gears are oriented 120 degrees apart (Type C) produces the minimum excitation and the lowest resultant dynamic transmission error. This is because such an arrangement promotes a more uniform load distribution and allows error harmonics to partially cancel out within the system, leveraging the inherent phase-shifted design of the two cycloid disks. This finding provides a valuable guideline for the selective assembly of high-precision RV reducers.
To validate the nonlinear dynamic model and the simulation results, an experimental test was conducted on an RV-80E reducer sample. The test setup is a dedicated precision transmission analyzer. The core of the setup involves mounting high-resolution rotary optical encoders (with a resolution of 0.1 arcsecond) directly onto the input and output shafts of the RV reducer. Torque sensors are also installed on both shafts to monitor loading conditions. The input is driven by a servo motor, and the output is connected to a programmable magnetic powder brake to apply a controlled load. The system records the angular positions of the input and output shafts simultaneously during operation. The dynamic transmission error is then computed in real-time as the difference between the measured output position and the theoretically expected output position based on the measured input position and the known reduction ratio.
The RV reducer was tested under various input speeds while under a constant nominal load. The key metrics recorded were the forward transmission error (peak-to-peak variation during clockwise rotation), the reverse transmission error (counter-clockwise rotation), and the hysteresis error (the difference in output position at the same input position when approaching from opposite directions). A subset of the experimental data is presented below.
| Test Run | Input Speed (rpm) | Forward Transmission Error (arcsec) | Reverse Transmission Error (arcsec) | Average Hysteresis Error (arcsec) |
|---|---|---|---|---|
| 1 | 600 | 53.1 | 45.4 | 33.5 |
| 2 | 1000 | 50.8 | 46.5 | 39.6 |
| 3 | 1200 | 47.2 | 52.4 | 39.6 |
The experimental data shows that the measured transmission errors are in the range of 45 to 55 arcseconds, which is in close agreement with the simulated peak error of 42.52 arcseconds from the coupled error model. The minor discrepancy can be attributed to additional error sources not fully modeled (e.g., housing deformation, thermal effects) and the specific tolerance values of the physical test specimen differing slightly from the simulation assumptions. The hysteresis error, a measure of nonlinear backlash and friction, is also consistently present. The error curves extracted from the encoders exhibit clear periodic patterns with both the long revolution cycle and the shorter tooth-meshing cycle, directly correlating with the characteristics observed in the simulation. This strong correlation between the experimental results and the nonlinear dynamic model validates the modeling approach and confirms that the identified error sources and their couplings are the primary drivers of dynamic transmission accuracy in RV reducers.
In conclusion, this comprehensive analysis of the nonlinear dynamic transmission accuracy of RV reducers has successfully integrated advanced modeling, simulation, and experimental validation. The mass-spring equivalent dynamic model, incorporating key nonlinearities from manufacturing errors, assembly misalignments, and clearances, proves to be a powerful tool for predicting the dynamic performance of these complex precision drives. The simulation studies provided critical insights: the radial position error of the pins in the pin wheel is a dominant manufacturing tolerance affecting RV reducer accuracy, and the strategic assembly of cycloid gears with a 120-degree phase shift between their major error vectors can significantly minimize the system’s transmission error excitation. The experimental testing on an RV-80E unit confirmed the theoretical predictions, with measured errors aligning closely with simulated values. The findings underscore that achieving the ultra-high precision required for advanced robotics is not solely a function of tight individual tolerances but also a systems engineering challenge involving the understanding and management of nonlinear error interactions within the RV reducer. This work provides a solid theoretical foundation and practical guidelines for the design, manufacturing, and assembly of next-generation high-performance RV reducers.