
The pursuit of precision in motion control, particularly within the domains of industrial robotics and aerospace mechanisms, demands transmission components of exceptional accuracy and reliability. Among these, the Rotary Vector Reducer stands out as a paramount solution. Its unique two-stage architecture, combining a planetary gear train with a cycloidal pin-wheel mechanism, yields an unparalleled combination of high reduction ratio, substantial torque capacity, compact size, and critically, high torsional stiffness and minimal backlash. These latter two parameters—stiffness and backlash—are decisive factors influencing the positional accuracy, repeatability, and dynamic response of the entire system. Therefore, the accurate and reliable measurement of these performance indicators is not merely a quality check but a fundamental requirement in the design, manufacturing, and application of high-end Rotary Vector Reducers.
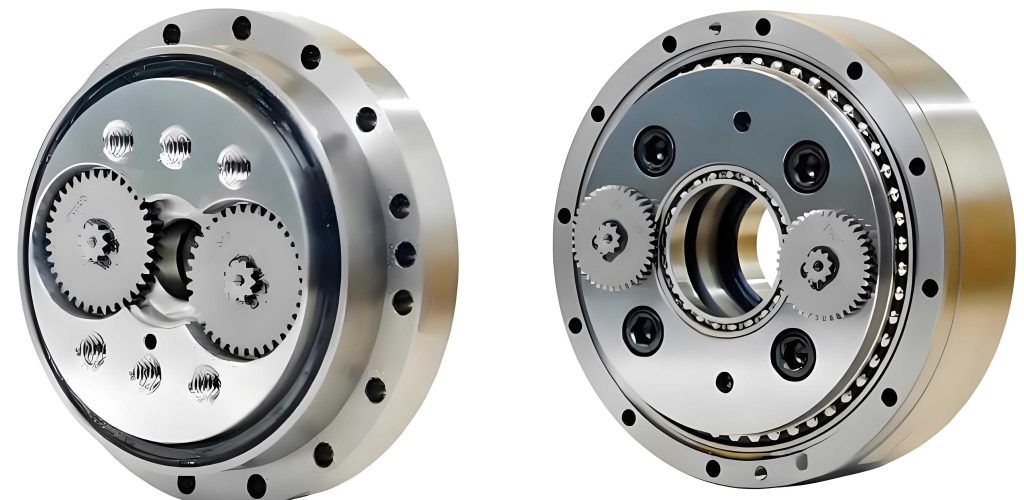
The internal structure of a Rotary Vector Reducer is a masterpiece of mechanical design, engineered for efficiency and precision. The first stage typically involves a standard planetary gear system, which provides an initial speed reduction. The second and defining stage employs a cycloidal disc meshing with a ring of stationary pins. This cycloidal engagement distributes load across multiple teeth simultaneously, inherently contributing to the high shock load tolerance and exceptional stiffness of the Rotary Vector Reducer. The compact design resulting from this two-stage arrangement is a key reason for its widespread adoption in space-constrained applications like robot joints.
Understanding the precise definitions of the measured parameters is crucial. Backlash, often referred to as lost motion or mechanical play, is the angular displacement experienced at the output shaft when the input shaft reverses direction without moving the output. In a Rotary Vector Reducer, this arises from the necessary micro-clearances between mating components—gear teeth (both involute and cycloidal), bearings, and splines—required for assembly, lubrication, and thermal expansion. For performance grading, the “no-load backlash” or “hysteresis loss” is measured by applying a small, alternating torque (e.g., ±3% of rated torque) to overcome internal friction, isolating the geometric play. It is usually expressed in arc-minutes or arc-seconds at the output.
Torsional Stiffness is a measure of a reducer’s resistance to elastic deformation under load. It quantifies how much the output shaft will twist relative to the input when a torque is applied. For a Rotary Vector Reducer, high stiffness is vital to maintain positioning accuracy under varying load conditions and to achieve high servo bandwidth in closed-loop control systems. Stiffness (K) is defined as the ratio of the applied output torque (T) to the resulting elastic angular deflection (θ) at the output:
$$ K = \frac{T}{\theta} $$
Its unit is typically Nm/arc-min or Nm/rad. A non-linear relationship often exists, where stiffness increases with applied torque as internal clearances are taken up and more teeth come into full contact.
The critical nature of these parameters for a Rotary Vector Reducer is evident when considering robotic precision. In a six-axis industrial robot performing a repetitive welding or assembly task, accumulated backlash from multiple Rotary Vector Reducers in each joint can lead to significant path deviation. Similarly, low stiffness allows the arm to deflect under its own weight or payload, causing a “soft” joint that vibrates and reduces machining accuracy. Thus, rigorous testing is indispensable.
Design Philosophy and Architecture of the High-Precision Test System
Conventional test methods for reducer backlash and stiffness often involve fixing the input and applying torque directly to the output shaft. While conceptually straightforward, this approach presents significant practical challenges for a high-ratio Rotary Vector Reducer. Applying the full rated output torque (often hundreds of Nm) requires a massive, expensive loading mechanism. Furthermore, measuring the resulting minute output rotation (often fractions of a degree) demands exquisitely sensitive and costly angular encoders, as the output displacement is reduced by the transmission ratio.
To circumvent these limitations, an innovative test methodology was conceived and implemented. The core principle is inverse loading: the output flange of the Rotary Vector Reducer is rigidly fixed, and a controlled torque is applied to the input shaft. The angular displacement is then measured at the input side. This approach offers profound advantages. Firstly, the required input torque is smaller by approximately the reduction ratio, allowing the use of a more compact, precise, and controllable servo motor for loading. Secondly, the angular displacement to be measured at the input is larger by the same ratio, relaxing the resolution requirements for the measurement encoder and improving the signal-to-noise ratio of the measurement. The data is later converted to equivalent output values using the known transmission ratio and a calibrated torque relationship.
The developed test system is an integration of precision mechanical fixtures, high-fidelity sensors, and automated control software. A high-stiffness, zero-backlash lock-up device clamps directly onto the output flange of the Rotary Vector Reducer under test (Unit Under Test, UUT), ensuring no extraneous rotation. A servo motor coupled with a high-resolution reducer acts as the prime mover and torque source for the input shaft. The system’s metrology core consists of two key sensors:
- Torque/Speed Sensor: A non-contact, flange-style transducer (e.g., based on magneto-elastic principles) is installed in-line between the loading motor and the UUT’s input shaft. It provides real-time measurement of the input torque (N1) and speed with high accuracy and negligible additional compliance.
- High-Resolution Angular Encoder: An optical incremental encoder with a very high line count (or its absolute equivalent) is mounted directly on the UUT’s input shaft. This directly measures the input angular displacement (φ1) with micro-radian resolution.
A programmable logic controller (PLC) or industrial PC coordinates the servo drive, data acquisition from the sensors, and executes the pre-defined test sequences. The system’s mechanical layout is designed to minimize parasitic deflections in the load path, and all connections use precise couplings to avoid introducing additional backlash.
| Component | Role | Key Specification / Model Example | Rationale |
|---|---|---|---|
| Servo Motor & Drive | Controlled Input Loading | High-torque, low-speed capability; Precise current/torque control mode. | Enables smooth, programmable torque application and reversal for hysteresis curve generation. |
| Input Torque Sensor | Measure Input Torque (N1) | e.g., ±5 Nm range, accuracy ±0.1% F.S. | Provides the direct measurement of the loading condition on the UUT input. |
| Input Angular Encoder | Measure Input Angle (φ1) | e.g., >20-bit resolution (over 1 million counts/rev), accuracy ±10 arc-sec. | High resolution allows detection of minute input displacements, which correspond to ultra-fine output movements after division by the large ratio. |
| Output Locking Fixture | Fix Output Shaft | Hydraulic or mechanical clamp with deflection < 0.001 mm under full load. | Absolute fixation is critical; any yield here is misinterpreted as reducer compliance. |
| Data Acquisition & Control | System Orchestration | High-speed synchronous sampling (>1 kHz) of all sensor channels. | Ensures torque and angle data points are perfectly paired for accurate hysteresis loop plotting. |
Comprehensive Test Protocol and Data Transformation Methodology
The test procedure is meticulously designed to capture the complete non-linear elastic behavior of the Rotary Vector Reducer. It consists of two primary phases: Torque Transmission Ratio Calibration and the Main Hysteresis Loop Test.
Phase 1: Torque Relationship Calibration. The ideal power balance for a lossless Rotary Vector Reducer is given by:
$$ T_{out, ideal} = i \cdot T_{in} $$
where \( i \) is the rated reduction ratio. However, efficiency losses due to friction in gears, bearings, and seals mean the actual output torque for a given input is less. More critically for our inverse method, to achieve a desired output torque \( T_{out} \) while the output is fixed, a larger-than-ideal input torque \( T_{in} \) must be applied to overcome these losses. Therefore, we must establish the empirical relationship \( T_{out} = f(T_{in}) \).
This is done by temporarily replacing the rigid lock with a calibrated output torque sensor (or using a reaction torque sensor on the lock itself). The servo motor slowly applies an increasing input torque. For each steady-state input torque \( T_{in} \), the corresponding reacted output torque \( T_{out} \) is recorded. This process maps the true load path through the Rotary Vector Reducer. Data from testing an RV-40E-type unit (rated output torque ~412 Nm, ratio i=121) yielded the following representative dataset:
| Output Torque, T_out (Nm) | 0 | 100 | 200 | 300 | 400 | 412 (Rated) |
|---|---|---|---|---|---|---|
| Input Torque, T_in (Nm) | 0.15 | 1.30 | 2.35 | 3.42 | 4.38 | 4.51 |
Plotting and fitting this data reveals a strong linear correlation with a positive intercept on the T_in axis, representing the static friction that must be overcome before any output torque is generated. A linear fit of the form:
$$ T_{out} = C + m \cdot T_{in} $$
is typically excellent. For the sample data, the fit might be:
$$ T_{out} = -14.2 + 94.5 \cdot T_{in} $$
This calibrated equation is fundamental. It allows us to calculate, for any measured input torque \( T_{in} \) during the main test (with output fixed), the equivalent output torque \( T_{out} \) that would be present at the output flange. The negative intercept is an artifact of the fitting and represents the threshold input torque needed to initiate internal motion.
Phase 2: Main Hysteresis & Stiffness Test. With the output rigidly locked and the torque relationship known, the definitive test is performed. The servo motor executes a slow, quasi-static torque cycle on the input shaft: \( 0 \rightarrow +T_{in,max} \rightarrow -T_{in,max} \rightarrow 0 \), where \( T_{in,max} \) is calculated from the calibrated equation to correspond to the desired maximum output torque (e.g., ±100% of rated torque). Throughout this cycle, simultaneous readings of input torque \( T_{in} \) and input angular displacement \( φ_{in} \) are collected at a high sampling rate.
Data Transformation to Output Domain: All analysis is best performed in the output domain for direct comparison with specifications. We apply two transformations:
- Torque Transformation: Use the calibrated equation \( T_{out} = f(T_{in}) \) to convert each \( T_{in} \) data point to its corresponding \( T_{out} \).
- Angle Transformation: The input rotation \( φ_{in} \) (in degrees or radians) is primarily due to the elastic wind-up of the Rotary Vector Reducer plus the take-up of internal clearance. The equivalent output rotation \( φ_{out} \) is given by:
$$ φ_{out} = \frac{φ_{in}}{i} $$
where \( i \) is the reduction ratio. For an RV-40E with i=121, an input rotation of 1 degree translates to an output rotation of approximately 0.496 arc-minutes.
After this transformation, we obtain the fundamental dataset: a series of points \( (T_{out}, φ_{out}) \) that describe a closed loop—the hysteresis loop or torsion characteristic curve of the Rotary Vector Reducer. This loop visually encapsulates both backlash (the width of the loop near zero torque) and stiffness (the slope of the loop’s sides).
Advanced Data Analysis: Stiffness Modeling and Backlash Extraction
The raw hysteresis loop data requires sophisticated analysis to extract the single-valued stiffness curve and the quantitative backlash value, as the loop exhibits pronounced non-linearity, especially at low torques.
1. Backlash Measurement: According to standard definitions (e.g., AGMA, ISO), the no-load backlash is the width of the hysteresis loop at the torque level corresponding to ±3% of the rated output torque. From the transformed data:
- Determine the output torque values: \( T_{+3\%} = +0.03 \times T_{rated} \) and \( T_{-3\%} = -0.03 \times T_{rated} \).
- For each torque level, find the corresponding output angles on the loading and unloading branches of the hysteresis loop. Due to data scatter, linear interpolation between adjacent data points is used.
- The backlash \( B \) is the absolute angular difference:
$$ B = | φ_{out}(T_{+3\%})_{loading} – φ_{out}(T_{+3\%})_{unloading} | $$
It is typically reported in arc-minutes. For a high-quality Rotary Vector Reducer, this value is often less than 1 arc-minute.
2. Stiffness Curve Derivation via Segmented Piecewise Modeling: The torsional stiffness \( K = dT/dφ \) is not constant. A robust method involves separating the hysteresis loop into its two primary branches: the forward (increasing torque) and return (decreasing torque) paths. Each branch is then analyzed separately to create a “mean elasticity curve.” A common and effective model is a piecewise polynomial fit.
The loop is divided into three torque regions based on the physical behavior of the Rotary Vector Reducer:
- Region I (Low Torque, ±0-20% Rated): This region is dominated by the take-up of internal clearances and non-linear contact deflections. Stiffness increases rapidly with torque.
- Region II (Medium Torque, ±20-80% Rated): The reducer operates in predominantly linear elastic deformation. The stiffness is relatively constant and reaches its characteristic value.
- Region III (High Torque, ±80-100% Rated): Saturation effects, material non-linearity, and full tooth flank contact may cause a slight increase in stiffness.
For each branch (forward and return), the data in each region is fitted with an appropriate model. Region II is often fitted with a simple linear regression. Regions I and III may require quadratic or higher-order polynomials to capture the curvature.
$$ \text{For Branch k: } φ_{out}^{(k)}(T) =
\begin{cases}
a_1^{(k)} + b_1^{(k)}T + c_1^{(k)}T^2 & \text{Region I} \\
a_2^{(k)} + b_2^{(k)}T & \text{Region II} \\
a_3^{(k)} + b_3^{(k)}T + c_3^{(k)}T^2 & \text{Region III}
\end{cases}
$$
The final quasi-static stiffness curve, representing the average elastic behavior, is obtained by calculating the mean of the two branches for each torque value:
$$ φ_{mean}(T) = \frac{φ_{out}^{(forward)}(T) + φ_{out}^{(return)}(T)}{2} $$
This \( φ_{mean}(T) \) function is the definitive relationship from which stiffness is derived. The torsional stiffness at any torque \( T_0 \) is the derivative:
$$ K(T_0) = \left( \frac{dφ_{mean}}{dT} \bigg|_{T=T_0} \right)^{-1} $$
A key industry metric is the spring constant, which is the stiffness value evaluated in the high-torque region (e.g., at 100% rated torque). It is calculated as:
$$ K_{spring} = \frac{ΔT}{Δφ_{mean}} $$
where \( ΔT \) is a small torque interval (e.g., 10 Nm) centered at the rated torque, and \( Δφ_{mean} \) is the corresponding mean angular deflection difference from the fitted curve.
| Performance Parameter | Test Method | Measured Value | Specification Limit | Pass/Fail |
|---|---|---|---|---|
| No-Load Backlash | Width at ±3% Trated | 0.94 arc-min | < 1.0 arc-min | Pass |
| Spring Constant (at Trated) | ΔT=10 Nm near 412 Nm | 115.2 Nm/arc-min | > 108 Nm/arc-min | Pass |
| Torsional Stiffness (at 50% Trated) | Derivative of mean curve | ~98 Nm/arc-min | – | – |
Discussion: System Validation, Advantages, and Industrial Relevance
The validity of the proposed inverse-load test system is confirmed by the logical consistency of the results and their compliance with product specifications. The obtained hysteresis loop exhibits the classic shape expected from a precision Rotary Vector Reducer: a narrow width signifying low backlash and progressively stiffening slopes. The success in accurately measuring a backlash under 1 arc-minute and a high spring constant demonstrates the system’s capability to resolve the fine mechanical characteristics of these components.
The advantages of this methodology are substantial:
- Enhanced Measurement Resolution: Measuring larger input angles effectively amplifies the output signal, reducing the relative impact of encoder quantization error.
- Reduced Cost and Complexity: Eliminating the need for a high-torque, low-rotation output loader and an ultra-high-resolution output encoder significantly lowers system cost.
- Improved Safety and Control: Applying lower input torques is inherently safer and allows for smoother, more precise servo control during the test cycle.
- Alignment with Internal Load Path: The method effectively simulates a real-world scenario where the output is constrained (e.g., a robot joint holding a position against a force), and the motor (input) must apply torque to maintain it.
Potential error sources must be acknowledged and mitigated. These include:
- Fixture Compliance: Any elasticity in the output locking fixture directly adds to the measured deflection. Using Finite Element Analysis (FEA) to design an ultra-stiff fixture and/or performing a blank test to characterize and subtract its compliance is essential.
- Bearing Play in Test Setup: Anti-backlash bearings must be used in all support structures for the input drive train.
- Temperature Effects: Testing should be conducted in a controlled environment, as temperature changes can affect lubrication viscosity, material elasticity, and clearances within the Rotary Vector Reducer.
- Data Sampling and Filtering: Adequate sampling rate and appropriate digital filtering are needed to reduce noise without distorting the true mechanical response.
The implications for the industry are significant. This test system provides manufacturers with a reliable tool for:
- Quality Assurance: 100% final testing of production Rotary Vector Reducers to ensure every unit meets its datasheet guarantees for backlash and stiffness.
- Design Verification: Validating new designs or design modifications (e.g., new bearing preload, gear tooth profile modifications) by quantitatively comparing prototype performance.
- Process Control: Identifying correlations between assembly processes (e.g., pinion depth, cycloid disc phase) and final performance, enabling process optimization.
- Supplier Qualification: Objectively evaluating and comparing Rotary Vector Reducers from different suppliers against a standardized, precise test protocol.
| Aspect | Traditional (Fix Input, Load Output) | Proposed Inverse Method (Fix Output, Load Input) |
|---|---|---|
| Required Loading Capacity | High (Full output torque: 100s-1000s Nm) | Low (~Output Torque / Reduction Ratio) |
| Angular Measurement Challenge | Measuring very small output rotations (< 1°) | Measuring larger input rotations (~Ratio * output rotation) |
| Encoder Resolution Requirement | Extremely High (e.g., < 0.1 arc-sec at output) | Moderate (e.g., < 10 arc-sec at input) |
| System Cost & Complexity | Very High | Significantly Lower |
| Control Precision & Safety | Challenging at high torque | Easier, safer due to lower forces |
Conclusion and Future Perspectives
The accurate characterization of backlash and torsional stiffness is a cornerstone in the application of Rotary Vector Reducers for high-precision motion systems. The inverse-load testing methodology presented here offers a pragmatic, high-precision, and cost-effective solution to this critical metrology challenge. By fixing the output and applying controlled torque to the input, the system leverages the reducer’s own transmission ratio to magnify the measurable displacement, thereby relaxing sensor requirements while enhancing overall accuracy. The rigorous data processing pipeline—involving torque transmission calibration, coordinate transformation, and advanced piecewise modeling of the hysteresis loop—enables the extraction of reliable, standard-compliant values for backlash and non-linear stiffness.
Experimental validation on a commercial RV-40E-121 Rotary Vector Reducer confirmed the system’s effectiveness, yielding results that precisely met the manufacturer’s stringent specifications. The proposed framework not only serves as a robust tool for quality control but also provides invaluable data for research and development aimed at pushing the performance boundaries of Rotary Vector Reducer technology. Future work may integrate thermal cycling into the test sequence to study the effects of temperature on performance, employ advanced non-linear system identification techniques for dynamic stiffness modeling, and further automate the system for integration into high-volume smart manufacturing lines. As the demand for ever-greater robotic precision grows, such advanced metrology systems will remain indispensable in harnessing the full potential of the Rotary Vector Reducer.