
My research focuses on the dynamic performance evaluation of RV reducers, which are critical components in industrial robots. The torsional vibration characteristics of an RV reducer directly influence the positioning accuracy and smoothness of motion of a robotic arm. Excessive vibration can lead to chatter, reduced path-following precision, and accelerated wear. While significant effort is devoted to the kinematic design and static performance of RV reducers, I believe that comprehensive dynamic testing under realistic load conditions is equally crucial for quality assurance and performance optimization. This article details my methodology for torsional vibration testing, signal analysis, and defect diagnosis for RV reducers, presenting a holistic approach to their dynamic assessment.
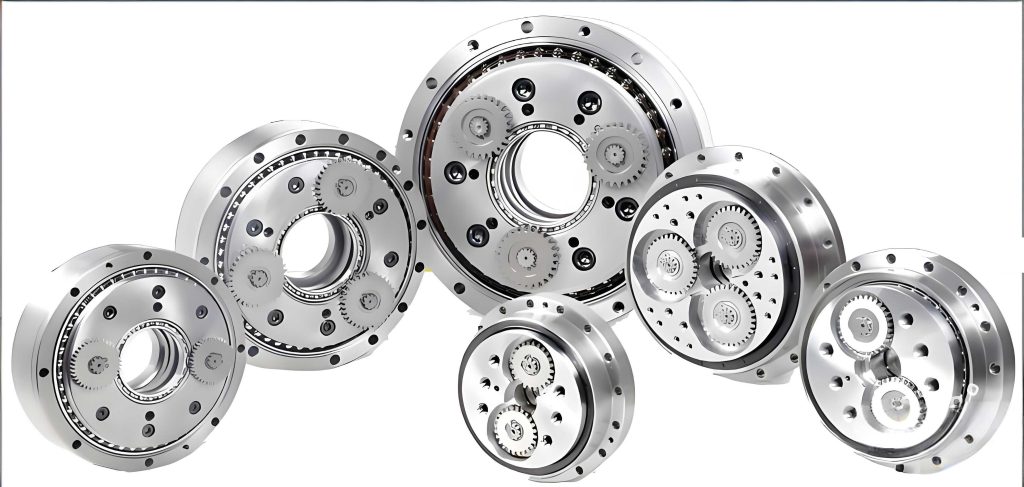
The unique two-stage design of the RV reducer is the source of its high reduction ratio, compactness, and high torque capacity, but also introduces complex dynamic interactions. The primary stage is a planetary gear train with involute spur gears, and the secondary stage is a cycloidal pin-wheel mechanism. This combination forms a closed differential gear train. The motion is transmitted from the input sun gear to two or three planetary gears, which are connected to eccentric shafts. These eccentric shafts drive the cycloidal discs (or摆线轮), which mesh with a stationary ring of pins (the pin gear). The slow rotation of the cycloidal discs is then output through a carrier. This intricate mechanism means that manufacturing imperfections in any component—gears, pins, cycloidal disc profiles, bearings, or eccentric shafts—can manifest as specific torsional vibration signatures at the output.
My testing philosophy is grounded in simulating real-world operating conditions. A key aspect often overlooked in bench tests is the inertial load presented by the robot arm. An RV reducer driving a massive arm is not just transmitting torque but is part of a coupled torsional dynamic system. Therefore, my test setup incorporates a significant rotational inertia to mimic this effect. The core of the test rig consists of a high-precision servo motor driving the RV reducer under test. The output flange of the RV reducer is connected to a large, carefully calculated inertial load disk. This configuration transforms the entire assembly from a simple speed reducer into a spring-mass torsional vibration system, where the RV reducer’s internal stiffness and the external inertia interact dynamically.
The measurement of torsional vibration is achieved indirectly but effectively. I mount a high-sensitivity, triaxial wireless accelerometer on the housing or a non-rotating part close to the output flange, aligned to measure tangential acceleration. Assuming negligible housing bending modes in the frequency range of interest, this tangential acceleration, $a_t$, at a known radius $R$ from the center of rotation, is directly proportional to the angular acceleration $\alpha$ of the output:
$$a_t = R \cdot \alpha$$
By processing this acceleration signal, one can derive angular velocity and angular displacement fluctuations, which define the torsional vibration. For comparative quality assessment, I often use the root-mean-square (RMS) value of the tangential acceleration or the derived displacement as a key performance indicator (KPI).
Test Protocol and Performance Characterization
I conduct tests across the operational speed range of the RV reducer. For an RV reducer with a reduction ratio, $i$, the input speed from the servo motor, $n_{in}$, is varied in steps (e.g., from 300 rpm to 2000 rpm). The corresponding output speed, $n_{out}$, is:
$$n_{out} = \frac{n_{in}}{i}$$
At each steady-state speed point, I acquire time-domain vibration data for a sufficient duration, typically covering several hundred output shaft revolutions to ensure statistical significance and capture low-frequency phenomena.
The raw time-domain signal for a healthy RV reducer often exhibits a distinctive “beat” pattern. This is a direct consequence of the multiple eccentric shafts (usually two, phase-shifted by 180°). As the eccentric shafts rotate, they impose a periodic variation in the meshing forces and load distribution within the cycloidal stage. The number of beats per output shaft revolution equals the number of eccentric shafts. This characteristic waveform is a useful qualitative check.
The primary quantitative result is the torsional vibration performance curve. This curve plots the RMS value of the measured tangential acceleration (or the derived displacement) against the input or output speed. It visually reveals the dynamic behavior of the specific RV reducer unit under its inertial load. Resonances appear as peaks in this curve. The speed at which a peak occurs and its amplitude are critical for performance evaluation. Industry standards, such as those suggested by leading manufacturers, often specify a maximum allowable vibration level (e.g., 0.1 G RMS acceleration) across the operational range. The performance curve allows for immediate pass/fail assessment against such criteria.
| Parameter | Value | Description |
|---|---|---|
| RV Reducer Model | RV-40E | Example test unit |
| Reduction Ratio ($i$) | 121 | Nominal ratio |
| Simulated Load Inertia ($J_L$) | 56.65 kg·m² | Mimics robot arm inertia |
| Input Speed Range ($n_{in}$) | 300 – 2000 rpm | Servo motor control |
| Measurement Radius ($R$) | 0.55 m | Radius for accel. measurement |
| Target Vibration Limit | < 0.1 G RMS | Example quality threshold |
Fundamental Characteristic Frequencies of the RV Reducer
Effective diagnosis requires a precise understanding of the kinematic frequencies inherent to the RV reducer’s design. These characteristic frequencies serve as fingerprints for different components. They are calculated based on the gear teeth numbers and the operating speed. Let us define the following parameters for a standard RV reducer:
- $z_1$: Number of teeth on the input sun gear.
- $z_2$: Number of teeth on the planetary gear (first stage).
- $z_c$: Number of lobes on the cycloidal disc (摆线轮).
- $z_p$: Number of pins in the stationary pin gear (针齿壳).
- $n_{in}$: Input shaft speed (rpm).
- $n_{out}$: Output shaft speed (rpm). The reduction ratio is $i = n_{in} / n_{out}$.
- $N$: Number of eccentric shafts (and cycloidal discs), typically 2.
The fundamental output rotational frequency, $f_{out}$, is:
$$f_{out} = \frac{n_{out}}{60} \quad \text{(Hz)}$$
The most critical meshing frequencies are:
- First Stage Planetary Meshing Frequency ($f_{m1}$): This is the frequency at which the teeth of the sun gear and planetary gears mesh.
$$f_{m1} = z_1 \cdot \frac{n_{in}}{60} = z_2 \cdot (z_p – 1) \cdot f_{out} \quad \text{(Hz)}$$ - Cycloidal Meshing Frequency ($f_{cyc}$): This is the frequency at which a lobe of the cycloidal disc passes a pin. It is also the rotational frequency of the cycloidal disc relative to the carrier.
$$f_{cyc} = (z_p – z_c) \cdot f_{out} = (z_p – 1) \cdot f_{out} \quad \text{(Note: Typically } z_p – z_c = 1\text{)}$$ - Pin Passage Frequency ($f_{pin}$): For a point on the cycloidal disc, this is the frequency at which it passes the pins. It is twice the cycloidal meshing frequency for a two-disc design.
$$f_{pin} = N \cdot f_{cyc} \quad \text{(Hz)}$$ - Planetary Gear Rotational Frequency ($f_{planet}$): The rotational speed of the planetary gear on its own axis.
$$f_{planet} = \left(1 – \frac{z_1}{z_2}\right) \cdot \frac{n_{in}}{60} \quad \text{(Hz)}$$
| Frequency Description | Symbol | Calculation Formula | Value (Hz) |
|---|---|---|---|
| Output Shaft Frequency | $f_{out}$ | $n_{in} / (60 \cdot i)$ | 0.165 |
| First Stage Meshing Frequency | $f_{m1}$ | $z_1 \cdot n_{in} / 60$ | 232.1 |
| Cycloidal Disc Rotation Freq. | $f_{cyc}$ | $(z_p – 1) \cdot f_{out}$ | 6.45 |
| Pin Passage Frequency | $f_{pin}$ | $N \cdot f_{cyc}$ | 12.90 |
| Planet Gear Spin Frequency | $f_{planet}$ | $(1 – z_1/z_2) \cdot n_{in}/60$ | 6.45 |
Signal Processing and Diagnostic Methodology
When the performance curve of an RV reducer shows abnormal peaks or consistently high vibration levels, I employ a suite of signal processing techniques to diagnose the root cause. The strategy is to correlate anomalous frequency content with the characteristic frequencies of the RV reducer’s components.
1. Spectral Analysis (FFT & STFT): The Fast Fourier Transform (FFT) converts the time-domain vibration signal into the frequency domain. A simple FFT at a problematic speed can reveal dominant frequency components. For non-stationary signals or to track changes with speed, I use the Short-Time Fourier Transform (STFT), which produces a spectrogram (time-frequency map). Peaks at $f_{pin}$, $f_{cyc}$, or their harmonics often point to issues in the cycloidal stage, such as pin diameter errors or cycloidal disc profile deviations.
2. Order Analysis: Since vibration is often synchronous with shaft speed, Order Analysis is invaluable. It resamples the vibration signal relative to the shaft rotation (using a tachometer signal), presenting amplitude versus “order” (multiple of shaft speed). This allows clear identification of vibrations that are exactly 1x, 2x, $f_{cyc}/f_{out}$x, etc., of the output speed, making it immune to slight speed fluctuations.
3. Envelope Demodulation: This is a powerful technique for diagnosing localized faults like spalls on bearing races or damaged gear teeth. These faults generate short-duration, high-frequency impulse responses each time the defect contacts another surface. The high-frequency “carrier” signal is amplitude-modulated at the fault’s characteristic rate. The process involves:
- Band-pass filtering the raw signal around a high-frequency resonant mode of the structure (often 1-10 kHz).
- Calculating the envelope (magnitude) of this filtered signal using the Hilbert Transform.
- Performing an FFT on the envelope signal to obtain the envelope spectrum.
Peaks in the envelope spectrum at $f_{planet}$, $f_{out}$, or bearing fault frequencies reveal the source of the impacting fault, even if it’s buried in noise in the standard spectrum.
4. Wavelet-Based Integration for Displacement: To accurately derive torsional displacement from acceleration, direct time-domain integration amplifies low-frequency noise. I employ a wavelet-based integration algorithm. The acceleration signal is decomposed using the Wavelet Transform. The approximation coefficients at a suitably chosen low-frequency scale, which contain the true vibration displacement information, are integrated directly. The detail coefficients (higher frequency noise) are subjected to a double integration with a custom scaling factor that minimizes noise amplification. The components are then reconstructed to yield a clean displacement signal. This method provides a more reliable vibration displacement waveform for analysis.
Case Studies in Defect Diagnosis
Case 1: Diagnosis of Oversized Pin Diameters. A tested RV-40E reducer exhibited a performance curve with a prominent, broad peak around 1500 rpm input speed, causing the RMS vibration to exceed the 0.1 G limit. Spectral analysis (STFT) of the data at this speed showed the dominant vibration energy was concentrated at approximately 16.3 Hz. Referring to the characteristic frequency table, this was very close to the expected pin passage frequency $f_{pin}$ for that specific output speed. The pin passage frequency is highly sensitive to the effective rolling radius of the cycloidal disc against the pins. An error in pin diameter distorts the theoretically perfect rolling motion, creating a periodic forcing function at this frequency. The broad peak in the performance curve suggested a distributed error (many pins slightly oversized) rather than a single defective pin. Upon inspection and measurement of the pin gear set, the pin diameters were confirmed to be consistently above the specified tolerance. Replacing the pin gear assembly with an in-tolerance unit and retesting resulted in a reduction of the peak vibration amplitude by over 30%, and the performance curve became much flatter, bringing the RV reducer within specification.
Case 2: Diagnosis of a Planetary Gear Defect. Another RV reducer unit showed a performance curve with sharp, narrow peaks at 800 rpm and 1200 rpm input speeds. The FFT spectrum at 1200 rpm revealed significant high-frequency content in the 300-350 Hz band, which did not correspond to any gear meshing frequency. This band was identified, through experimental modal analysis (bump test) on the stationary test rig, as a torsional resonant frequency of the combined system (RV reducer stiffness and load inertia). This is an operational deflection shape frequency excited by internal forces. To find the source of the excitation, I applied envelope demodulation. I band-pass filtered the raw signal around the 330 Hz resonance and computed its envelope spectrum. The envelope spectrum showed a clear, dominant peak at 6.4 Hz. This frequency matched the planetary gear rotational frequency ($f_{planet}$) for that input speed. The diagnosis was a localized defect on the planetary gear, such as a profile error or a small spall on a tooth. This defect caused a periodic impact every time the faulty tooth meshed, exciting the system’s torsional resonance. The sharp peaks in the performance curve occurred when the impact frequency ($f_{planet}$) or its harmonics coincided with the system’s natural frequency, causing resonance. Replacing the planetary gear set eliminated the high-frequency resonant excitation, the sharp peaks vanished from the performance curve, and the overall vibration levels dropped significantly.
| Suspected Defect | Typical Vibration Signature | Primary Diagnostic Method | Key Indicator Frequency |
|---|---|---|---|
| Pin Diameter Error / Wear | Broad peak in perf. curve; elevated vibration at & around $f_{pin}$. | Spectral Analysis (STFT), Order Tracking. | Pin Passage Freq. ($f_{pin}$) and harmonics. |
| Cycloidal Disc Profile Error | Elevated vibration at $f_{cyc}$; increased harmonic content. | Spectral Analysis, Order Tracking. | Cycloidal Meshing Freq. ($f_{cyc}$). |
| Planetary Gear Tooth Fault | Sharp resonant peaks in perf. curve; high-freq. bursts. | Envelope Demodulation. | Planet Gear Spin Freq. ($f_{planet}$) in envelope spectrum. |
| Eccentricity / Unbalance | High vibration at 1x output rotation frequency ($f_{out}$). | Spectral Analysis, Order Analysis (1st order). | Output Shaft Frequency ($f_{out}$). |
| Bearing Defects (RV bearings) | High-freq. noise; specific modulating frequencies. | Envelope Demodulation, High-Frequency Resonance Technique. | Bearing fault frequencies (BPFO, BPFI, etc.) in envelope spectrum. |
Conclusion and Perspectives
The methodology I have developed provides a rigorous, practical framework for the torsional vibration testing and diagnosis of RV reducers. By incorporating a realistic inertial load, the test captures the dynamic interaction between the RV reducer’s internal stiffness and the robot arm’s inertia, revealing resonances and performance limits that unloaded tests would miss. The torsional vibration performance curve serves as an excellent overall health indicator and quality gate.
Beyond pass/fail testing, advanced signal analysis transforms the vibration signal into a rich source of diagnostic information. The fundamental characteristic frequencies of the RV reducer act as a decoding key. Techniques like envelope demodulation are particularly effective for pinpointing localized faults like gear tooth damage, while spectral and order analysis excel at identifying distributed manufacturing errors related to the cycloidal stage. The integration of these methods allows for a transition from simply detecting a problem to specifically diagnosing its root cause—whether it lies in the pin gear, cycloidal disc, planetary stage, or bearings.
This approach is invaluable for RV reducer manufacturers in several ways. It enables final product validation against dynamic performance standards. It provides critical feedback to the production and assembly lines, helping to identify and rectify recurring manufacturing or assembly issues. Furthermore, it can be used for life testing and condition monitoring, predicting remaining useful life based on the evolution of vibration signatures. As the demand for higher precision and reliability in industrial robotics grows, such comprehensive dynamic testing and diagnosis will become an indispensable part of the RV reducer quality assurance and development process, ensuring that every unit delivers the smooth, precise motion required for advanced automation.