
In the realm of precision motion control and robotic actuation, the strain wave gear, commonly known as a harmonic drive, stands as a pivotal component. Its unique operating principle, relying on the elastic deformation of a flexible spline, grants it exceptional capabilities such as high reduction ratios, zero-backlash operation (in theory), compactness, and high torque density. These attributes make the strain wave gear indispensable in aerospace, semiconductor manufacturing, and high-precision robotic systems. However, a critical characteristic that directly influences positioning accuracy, servo stability, and dynamic response is its torsional stiffness. This property defines the angular deflection of the input shaft under an applied torque. For systems requiring micron-level precision or subjected to varying load directions, understanding the non-linear behavior of this stiffness, particularly the pronounced hysteresis observed during torque reversal, is paramount. This article delves into the intricacies of measuring the input shaft torsional stiffness of a precision strain wave gear under low torque conditions, presents a dedicated test system, and analyzes the resulting hysteretic behavior.
Fundamental Principles of Measurement
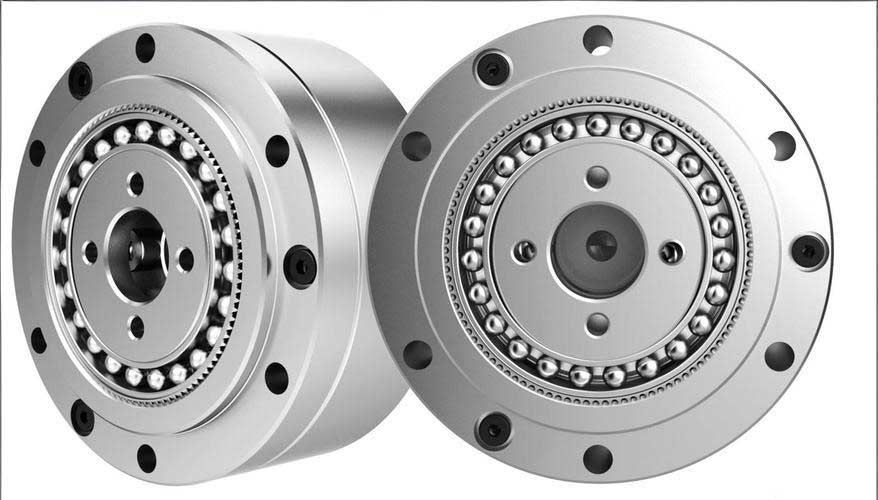
The core function of a strain wave gear system involves three primary components: the circular spline (or rigid ring), the flexspline (or flexible cup), and the wave generator. The wave generator, typically an elliptical cam bearing assembly, deforms the flexspline, causing its external teeth to engage with the internal teeth of the circular spline at two diametrically opposite points. By fixing one component and rotating another, high reduction ratios are achieved. For the purpose of characterizing the input stiffness, a common configuration is employed: the circular spline is held stationary, the flexspline is fixed at its output flange, and torque is applied to the wave generator, which serves as the input element. This setup isolates the torsional compliance of the gear assembly from the output load.
The measurement principle rests on applying a precisely known pure torque to the input shaft and accurately measuring the resulting angular displacement. A pure torque, which induces rotation without translational forces, is best applied as a force couple. A force couple consists of two parallel forces of equal magnitude but opposite direction, separated by a perpendicular distance. The torque \( T \) is given by:
$$ T = F \cdot d $$
where \( F \) is the magnitude of each force and \( d \) is the distance between their lines of action. In our system, this is implemented via a loading disk attached to the input shaft. Two pairs of forces are applied tangentially to the disk’s perimeter, allowing for the application of bidirectional torque.
The angular displacement \( \theta \) is measured using a non-contact, vision-based method to avoid any influence from physical contact sensors. A target featuring two high-contrast circular markers is affixed to the torque loading disk. A CCD camera captures an image of the target in its unloaded (reference) state. After applying torque and allowing the system to settle, a second image is captured. Sophisticated image processing software then identifies the centroids of the markers in both images.
Let the centroid coordinates of the two markers in the reference image be \( (x_1, y_1) \) and \( (x_2, y_2) \). The line connecting them forms a reference vector. After rotation, the new centroid coordinates are \( (x_3, y_3) \) and \( (x_4, y_4) \), defining a new vector. The slopes of these lines are:
$$ k_1 = \frac{y_2 – y_1}{x_2 – x_1}, \quad k_2 = \frac{y_4 – y_3}{x_4 – x_3} $$
The relative rotation angle \( \theta \) (in radians) is then calculated as:
$$ \theta = \arctan(k_2) – \arctan(k_1) $$
This method provides a highly accurate and frictionless means of determining small angular deflections, which are critical for assessing the strain wave gear’s compliance.
The accuracy of the centroid detection is paramount. We employ a multi-point circle fitting algorithm based on the least-squares principle. For a set of \( n \) edge points \( (x_i, y_i) \) belonging to the image of a circular marker, we fit a circle with center \( (a, b) \) and radius \( r \). The objective is to minimize the sum of squares of the residuals \( \epsilon_i \):
$$ \epsilon_i = (x_i – a)^2 + (y_i – b)^2 – r^2 $$
The minimization condition \( \frac{\partial}{\partial a} \sum \epsilon_i^2 = \frac{\partial}{\partial b} \sum \epsilon_i^2 = \frac{\partial}{\partial r} \sum \epsilon_i^2 = 0 \) leads to a system of equations solved to obtain the precise center coordinates \( (a, b) \). This sub-pixel accuracy is essential for reliable angle computation.
Design and Implementation of the Torsional Stiffness Test System
To conduct a comprehensive evaluation, a specialized test rig was developed. The system’s primary design goals were: 1) Application of a pure, bidirectional, and continuously variable torque, 2) High-resolution, non-contact angle measurement, and 3) Rigid mounting to isolate the strain wave gear’s deflection from fixture compliance.
The mechanical assembly centers on a rigid “gate-type” frame. The strain wave gear under test is mounted such that its circular spline is clamped to the frame. The flexspline’s output flange is bolted to a massive vertical backplate, effectively fixing it against rotation. The wave generator (input shaft) is extended and securely coupled to a large-diameter, lightweight torque loading disk. This disk has four tangential attachment points, arranged symmetrically to allow for two independent force couples.
The torque generation system is a key innovation. It comprises 12 low-friction pulleys arranged symmetrically on either side of the rig. Four lightweight cords are attached to the disk’s tangency points. Each cord runs over a series of pulleys and terminates at a weight pan. By adding or removing calibrated masses to the weight pans, torque can be applied in either direction. The symmetrical pulley arrangement allows torque to be varied continuously from a positive maximum, through zero, to a negative maximum, and back, without reconfiguring the setup. This enables the seamless acquisition of a complete hysteresis loop. The applied torque \( T \) is calculated as:
$$ T = m \cdot g \cdot r $$
where \( m \) is the total mass added to one pair of weight pans, \( g \) is gravitational acceleration, and \( r \) is the radius of the torque loading disk.
The measurement chain consists of a high-resolution monochrome CCD camera (DH-SV1400FM) mounted on a stable tripod, pointed directly at the target on the torque disk. The camera is connected to a PC running custom image acquisition and processing software. The software controls image capture, performs the circle fitting and angle calculation algorithms, and logs the angle data synchronized with the applied torque value.
The experimental procedure for capturing a full hysteresis cycle is as follows:
- Initialization: With the system at rest and a baseline torque applied in the positive direction (e.g., +0.36 N·m), a reference image of the target is captured.
- Positive Unloading: Mass is incrementally removed from the “positive” weight pans, reducing the torque to zero. An image is captured at each equilibrium step.
- Negative Loading: Mass is incrementally added to the “negative” weight pans, applying torque in the opposite direction until reaching the negative maximum (e.g., -0.36 N·m). Images are captured at each step.
- Negative Unloading: Mass is incrementally removed from the negative pans, returning the torque to zero.
- Positive Loading (Return): Mass is added back to the positive pans to return to the initial positive maximum torque.
This forms one complete measurement cycle, tracing out the full hysteresis loop. To assess variability, the test is repeated with the flexspline assembly rotated to different angular positions relative to the fixed backplate (e.g., 0°, 60°, 120°).
| Component | Specification / Model | Purpose |
|---|---|---|
| Strain Wave Gear | Precision Type, 1:100 Ratio | Device Under Test (DUT) |
| Torque Loading Disk | Diameter 200 mm, Aluminum | Apply pure torque via force couples |
| CCD Camera | DH-SV1400FM | Non-contact image acquisition |
| Lens | Fixed focal length, 25mm | Provide clear target image |
| Calibrated Masses | 25g, 100g (Set of 25) | Generate precise torque steps |
| Pulley System | 12 low-friction bearings | Guide cords, enable bidirectional loading |
| Data Acquisition PC | Custom Software in C++/Python | Control, image processing, and logging |
Analysis of Torsional Stiffness and Hysteretic Behavior
The primary output of the test is the angle-torque characteristic curve. For the tested precision strain wave gear, this curve is distinctly non-linear and forms a pronounced hysteresis loop. The loop is segmented into four distinct regimes corresponding to the stages of the test cycle: Positive Unloading, Negative Loading, Negative Unloading, and Positive Loading.
Torsional stiffness \( k \) is defined as the incremental change in torque per unit angular deflection:
$$ k = \frac{\Delta T}{\Delta \theta} $$
where \( \Delta T \) is the change in applied torque and \( \Delta \theta \) is the resulting change in angular displacement (in radians). In practice, the local stiffness is the inverse of the slope of the angle-torque curve. A more convenient representation is often the slope \( K \) of the curve itself (\( \theta \) vs. \( T \)), which relates to stiffness as:
$$ K = \frac{\Delta \theta}{\Delta T} = \frac{1}{k} $$
We report stiffness in N·m/rad. Hysteresis, in this context, is quantified as the maximum angular separation between the loading and unloading paths for the same torque value within the tested range, typically expressed in arcminutes or degrees.
| Flexspline Position | Positive Unloading Stiffness (N·m/rad) | Negative Loading Stiffness (N·m/rad) | Negative Unloading Stiffness (N·m/rad) | Positive Loading Stiffness (N·m/rad) | Total Hysteresis (degrees) |
|---|---|---|---|---|---|
| 0° (Initial) | 4.51 | 0.31 | 4.85 | 0.30 | 50.5 |
| 60° | 4.36 | 0.29 | 3.59 | 0.33 | 51.9 |
| 120° | 4.19 | 0.32 | 5.08 | 0.33 | 49.4 |
The data reveals a critical insight: the strain wave gear exhibits two dramatically different stiffness regimes. The high-stiffness regimes (Positive Unloading and Negative Unloading) occur when the gear is moving from a state of pre-loaded engagement in one direction back towards zero torque. In these phases, the internal components (wave generator, flexspline teeth, circular spline teeth) are in firm contact, and the elastic deflection is primarily due to the material strain of the flexspline cup and torsional wind-up of the wave generator. Stiffness values here range from approximately 3.6 to 5.1 N·m/rad.
Conversely, the low-stiffness regimes (Negative Loading and Positive Loading) occur when torque is applied from zero, initiating motion in the opposite direction. Here, the stiffness is an order of magnitude lower, around 0.3 N·m/rad. This drastic reduction is attributed to the phenomenon of “lost motion” or “wind-up” associated with overcoming internal compliances. As torque is applied from zero, the initial rotation is consumed by taking up backlash (despite claims of zero-backlash), compressing anti-backlash mechanisms, overcoming static friction in the wave generator bearing, and allowing for minor micro-slip in the tooth engagements before full elastic deformation of the flexspline body dominates. This region is characterized by high compliance. A particularly notable feature is a sharp drop in stiffness, or a “soft spot,” observed in the torque range of approximately ±(0.1 to 0.2) N·m during this reversal phase.
The hysteretic loop is a direct consequence of these different stiffness paths and energy loss mechanisms. The area enclosed within the loop represents energy dissipated per cycle, primarily as heat from friction (Coulomb friction in the wave generator bearing, hysteresis in the flexspline material, and micro-slip at gear teeth interfaces) and possibly from damping in the elastomeric components. Our measurements consistently show a total hysteresis of about 50°, regardless of the flexspline’s rotational position relative to the fixed mount. This suggests that the hysteresis is a systemic property of the strain wave gear assembly itself, not an artifact of a particular tooth engagement pattern, although minor variations in high-stiffness values are observed.
Discussion: Implications and Parameter Dependence
The existence of a large hysteresis loop and a very low stiffness zone during torque reversal has significant implications for systems employing strain wave gears.
- Servo Control: For high-performance servo systems, particularly those involving frequent direction changes (e.g., contour following in robotics), the low reversal stiffness acts as a non-linear spring in the drive train. This can challenge controller tuning, potentially leading to instability, limit cycling, or reduced bandwidth. The 50° of hysteresis at the input translates to a significantly larger lost motion at the output due to the gear ratio, degrading positional repeatability.
- Precision Positioning: Any bidirectional positioning move must account for this hysteresis. Strategies like always approaching a target position from the same direction (“unidirectional positioning”) or using advanced compensation maps that model the hysteresis loop are necessary for achieving micron-level accuracy.
- Stiffness Modeling: A simple linear spring model is insufficient for a strain wave gear. A more accurate model is a hysteretic spring, such as a Preisach or Bouc-Wen model, or a piecewise linear model with different stiffness values for different torque quadrants and a memory of the loading history.
The stiffness and hysteresis are not fixed constants but depend on several operational and design parameters of the strain wave gear:
| Parameter | Effect on High-Stiffness Regime | Effect on Low-Stiffness (Reversal) Regime | Effect on Hysteresis |
|---|---|---|---|
| Applied Torque Level | Generally increases with preload, but may saturate. | May become slightly stiffer at higher torques but remains low relative to high-stiffness regime. | Hysteresis loop area typically increases with torque amplitude. |
| Gear Reduction Ratio | Higher ratio gears often have a more compliant flexspline, potentially reducing stiffness. | The reversal zone is a system property but scales with the gear’s physical size and design. | May scale with the physical size and design of the gear unit. |
| Flexspline Material & Heat Treatment | Directly determines elastic modulus. High-strength steel with optimal heat treatment maximizes stiffness. | Material yield strength and fatigue limits influence the micro-yielding and friction during reversal. | Material internal damping characteristics directly contribute to hysteresis. |
| Wave Generator Bearing Preload | Higher preload increases bearing stiffness, contributing to overall system stiffness. | Higher preload increases static friction, potentially widening the very low stiffness reversal zone. | Increases friction-related energy loss, enlarging the hysteresis loop. |
| Operating Temperature | Stiffness may decrease slightly with rising temperature due to reduced material modulus. | Friction coefficients may change with temperature, altering the reversal behavior. | Can vary due to changes in lubrication viscosity and material properties. |
The test methodology presented here is particularly suited for characterizing these effects. For instance, by varying the maximum torque in the cycle, one can probe the dependence of hysteresis area on torque amplitude. By testing multiple units of the same model, statistical variations in performance can be assessed. Furthermore, the non-contact measurement ensures that the measured compliance is solely that of the strain wave gear, not contaminated by the stiffness of a coupled encoder or torque sensor.
Conclusion
Through the development and application of a specialized torsional stiffness test system utilizing force-couple torque application and non-contact vision-based angle measurement, the complex mechanical behavior of a precision strain wave gear has been quantitatively characterized. The central finding is that the input shaft’s angle-torque relationship is dominated by a large hysteresis loop, revealing two distinct operational stiffness states. The high-stiffness state (approximately 4-5 N·m/rad) is active when the gear is unloaded from a pre-engaged condition. The low-stiffness state (approximately 0.3 N·m/rad) governs the critical period of torque reversal, where internal compliances are taken up. This transition is marked by a pronounced soft spot near ±(0.1–0.2) N·m.
The total hysteresis, measured at about 50° of input rotation, was found to be consistent across different assembly orientations of the flexspline, indicating it is an intrinsic property of the gear design. This significant hysteresis and the stark stiffness asymmetry during reversal have direct and profound consequences for the design of high-performance motion control systems. Engineers must account for this non-linear, history-dependent compliance when modeling system dynamics, designing control algorithms, and specifying positioning accuracy. The presented test method provides a reliable and precise framework for obtaining the essential data needed for these tasks, enabling better integration and performance prediction of strain wave gears in advanced mechatronic systems. Future work may focus on modeling the hysteresis loop with advanced mathematical structures and correlating the measured parameters with long-term wear and performance degradation of the strain wave gear.