
In the field of industrial robotics and CNC machining, the rotary vector reducer plays a critical role due to its compact size, high reduction ratio, substantial power capacity, and superior precision. As a key component in robotic joints, the performance of the rotary vector reducer directly impacts the overall accuracy and reliability of the system. Currently, high-precision rotary vector reducers dominate the market, but there is a growing need for localized research and development to enhance their design and manufacturing. In this study, we focus on developing an online detection system that evaluates the motion precision of rotary vector reducers under simulated working conditions. Our aim is to provide a robust tool for optimizing component design and ensuring high qualification rates before mass production.
The motion precision of a rotary vector reducer encompasses factors such as positioning accuracy, repeatability, and vibration characteristics. These parameters are vital for assessing the reducer’s performance in dynamic environments. Traditional static testing methods fall short in capturing the real-time behavior of the reducer during operation. Therefore, we propose an integrated system that leverages non-contact sensing technology and advanced data processing to monitor motion precision online. This system not only facilitates multi-station comparative testing but also offers analytical capabilities to interpret data trends, thereby guiding design improvements.
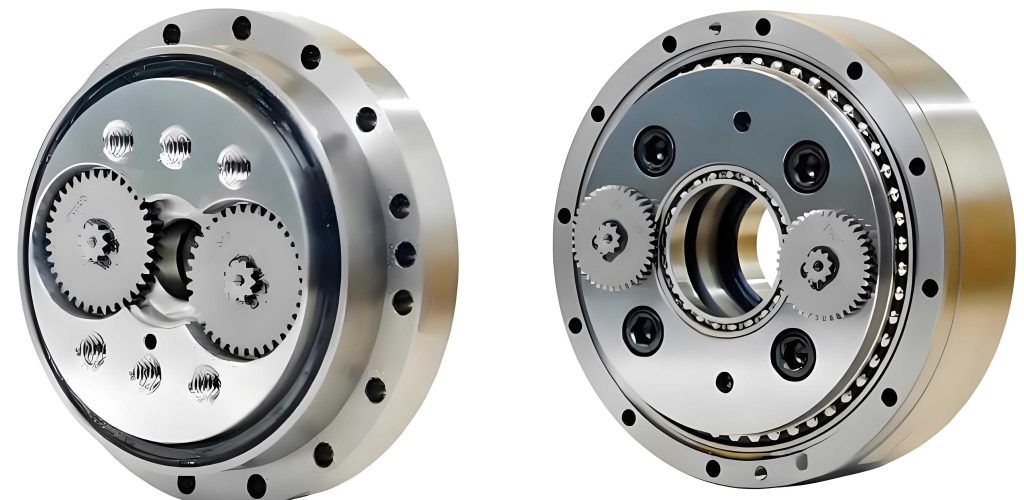
The core of our detection system lies in its modular architecture, which ensures flexibility and accuracy. We have designed the system to mimic the actual operational scenarios of industrial robots, allowing for controlled experiments with variable loads and speeds. By employing eddy current sensors and high-speed data acquisition, we can capture minute displacements in the rotary vector reducer’s output arm. The data is then processed using custom software built on VC++ and Access database technologies, enabling real-time visualization and storage. Through systematic analysis, we identify how individual components, such as the cycloid gear and crankshaft, influence the overall motion precision of the rotary vector reducer. This approach provides valuable insights for refining manufacturing processes and extending the service life of these reducers.
To elaborate, the detection system comprises several interconnected modules that work in harmony. Below is a summary of the key modules and their functions:
| Module | Description | Key Components |
|---|---|---|
| Motion Control Module | Governs the servo motor’s operation, enabling programmable speed, angle, and frequency settings for comparative tests. | Servo motor, control encoder, programming interface |
| RV Reducer Load Module | Simulates real-world working conditions by applying adjustable loads to the output arm, mimicking robotic joint stresses. | Load arm, weight system, mounting fixtures |
| Eddy Current Sensor Module | Measures non-contact displacements with high sensitivity, providing voltage outputs proportional to gap changes. | ECL202e series sensors, adjustment支架, signal cables |
| Data Acquisition Module | Captures sensor data, performs analog-to-digital conversion, and transmits it to the upper computer for processing. | PCI-9222 DAQ card, SCSI-VHDCI connectors, terminal blocks |
| Upper Computer Module | Hosts the software for data processing, real-time display, storage, and alarm triggering based on threshold values. | Industrial PC, monitor, VC++ MFC application, Access database |
The system operates in a symmetric dual-channel configuration, allowing for parallel synchronous data acquisition. This design enhances reliability and enables direct comparison between different test conditions or reducer units. Each channel utilizes identical eddy current sensors and acquisition parameters to ensure consistency. The workflow begins with the motion control module driving the servo motor, which in turn rotates the rotary vector reducer. The load module applies a specified force to the output arm, creating a realistic operational environment. As the arm moves, the eddy current sensors detect positional changes, generating analog signals that are captured by the data acquisition module. These signals are converted to digital values and sent to the upper computer, where they undergo filtering and analysis before being stored in a database.
In designing the acquisition system, sensor selection was paramount. Eddy current sensors are ideal for this application due to their non-contact nature, high linearity, and immunity to electromagnetic interference. The working principle is based on the eddy current effect, where the impedance of a coil varies linearly with the distance to a conductive target. For our system, we chose sensors with a sensitivity of 2.857 mV/μm and a detection range of 35 mm. The output voltage ranges from 0 to 10 VDC, with a linear error of 0.02%. The relationship between the output voltage \( V \) and the displacement \( d \) can be expressed as:
$$ V = k \cdot d + V_0 $$
where \( k \) is the sensitivity (2.857 mV/μm), and \( V_0 \) is the offset voltage. This linear model allows for accurate conversion from voltage to displacement. The system’s anti-interference capability was verified experimentally, resulting in a noise level of approximately 3.15 μm, calculated as:
$$ \Delta d = \frac{\Delta V}{k} = \frac{(3.946 – 3.937) \, \text{V}}{2.857 \, \text{mV/μm}} = 3.15 \, \mu\text{m} $$
This ensures that the measurements are robust against environmental disturbances.
The data acquisition card is a critical component that interfaces the sensors with the computer. We selected a PCI-9222 card with 2-channel synchronous analog output and 16-channel analog input capabilities. Its specifications include a 16-bit resolution, a maximum sampling rate of 250 kHz, and input ranges selectable from ±10 mV to ±250 mV. This card supports the sensor’s 15 kHz sampling frequency and 0-10 V output range. The data acquisition process involves two parallel threads that handle each channel independently, as illustrated in the flow chart. Data is buffered, converted, and then transferred to the software for further processing. The card’s compatibility with various programming languages and operating systems facilitated seamless integration with our VC++ application.
Moving to the data processing system, the upper computer module is built on a VC++ platform using MFC (Microsoft Foundation Classes) for the user interface. The software performs several key functions: parameter configuration, real-time data display, historical data query, and analytical operations. The main program flowchart outlines the sequence from motor startup to data storage. Users can set acquisition parameters such as sampling frequency and length, select channels, and monitor the system status. An alarm mechanism is implemented to trigger alerts when displacement values exceed predefined thresholds, protecting both the sensors and the rotary vector reducer from potential damage.
Data filtering is essential to eliminate noise and enhance measurement accuracy. We employ a combined filtering technique: “optimized median filtering” followed by “arithmetic mean filtering.” The optimized median filter removes outliers from the beginning and end of each data segment, addressing sensor jitter during start and stop phases. The arithmetic mean filter then smooths the data by averaging a window of samples. Mathematically, the process is as follows:
First, let \( X_j \) represent raw data points from the acquisition card, where \( j = 0, 1, 2, \dots \). The first filtering step computes the average of every five consecutive points:
$$ \text{Data}[i] = \frac{X_{5j} + X_{5j+1} + \cdots + X_{5j+4}}{5} \quad \text{for} \quad i = 0, 1, \dots, m $$
where \( m \) is the total number of points after this initial processing. Next, we “trim the head and tail” of the Data array to exclude edge effects. The midpoint \( \text{Data}[m/2] \) is selected as the target point. A window of 12 points around this target (5 before and 6 after) is averaged for the second filter:
$$ P_k = \frac{\text{Data}\left[\frac{m}{2} – 5\right] + \cdots + \text{Data}\left[\frac{m}{2} + 6\right]}{12} \quad \text{for} \quad k = 0, 1, 2, \dots $$
This yields the final displacement value \( P_k \). The error fluctuation \( B_i \) is then calculated relative to a baseline \( P_0 \):
$$ B_i = P_i – P_0 $$
Plotting \( B_i \) over multiple trials allows us to analyze repeatability and long-term trends in the rotary vector reducer’s motion precision.
Communication between the hardware and software is managed through VC++ programming. The application registers the DAQ card, configures communication settings, and uses mapping variables and functions to control data flow. When the eddy current sensor detects the start position, it sends a trigger signal to begin acquisition. Data is streamed to the card’s buffer, converted, and then transferred to the software buffer upon command. The software converts voltage values to displacements using the linear relationship, stores them in an Access database, and updates the real-time graph on the interface. This seamless communication ensures efficient data handling and minimal latency.
System debugging and calibration are crucial for accurate measurements. Initially, sensor positioning must be adjusted to ensure that trigger signals fall within valid ranges. We also tune sampling parameters, such as frequency and point count, to synchronize data acquisition with the motor’s rotation speed. Once calibrated, the system can reliably capture motion precision data. To evaluate the rotary vector reducer, we analyze key metrics like vibration error and positioning error. Vibration error refers to the tremors in the output arm during operation, which can indicate issues with component design or assembly. Positioning error reflects the consistency of the arm’s stop位置 across multiple cycles.
Experimental results from our tests provide concrete insights. For instance, vibration error data from a series of runs is summarized below:
| Test Number (n) | Vibration Amplitude (mm) | Notes |
|---|---|---|
| 1 | 0.008 | Low tremor, stable operation |
| 2 | 0.012 | Slight increase due to load change |
| 3 | 0.015 | Moderate vibration, check alignment |
| 4 | 0.010 | Improved after adjustment |
| 5 | 0.009 | Consistent performance |
This data helps correlate vibration levels with specific operational conditions, guiding design tweaks for the rotary vector reducer. Similarly, positioning error analysis reveals how design optimizations impact accuracy. Before optimization, we observed significant jumps in positioning values at certain points, as shown in a plot of displacement versus test number. After refining components like the cycloid gear and crankshaft, these jumps reduced markedly. The improvement can be quantified using the standard deviation of positioning errors:
$$ \sigma_{\text{before}} = \sqrt{\frac{1}{N} \sum_{i=1}^{N} (d_i – \bar{d})^2 } $$
where \( d_i \) are individual displacement measurements, and \( \bar{d} \) is the mean. Post-optimization, \( \sigma_{\text{after}} \) decreased by approximately 30%, demonstrating enhanced stability. These findings underscore the importance of precise component manufacturing and assembly for the rotary vector reducer.
Further analysis involves mathematical modeling of the rotary vector reducer’s dynamics. The motion precision can be described through a transfer function that relates input motor rotation to output arm displacement. Considering factors like backlash, stiffness, and damping, we can express the system as:
$$ G(s) = \frac{\theta_{\text{out}}(s)}{\theta_{\text{in}}(s)} = \frac{K}{Js^2 + Cs + K} $$
where \( \theta_{\text{in}} \) and \( \theta_{\text{out}} \) are input and output angles, \( J \) is the moment of inertia, \( C \) is the damping coefficient, and \( K \) is the stiffness. By fitting experimental data to this model, we can identify parameter values that correlate with observed errors. For example, a low \( K \) might indicate excessive flexibility in the cycloid gear, leading to positioning inaccuracies. This modeling approach provides a theoretical foundation for optimizing the rotary vector reducer’s design.
In addition to error analysis, our system enables fatigue life estimation. By subjecting the rotary vector reducer to repeated cycles under varying loads, we collect displacement data over time. The cumulative error growth can be modeled using a power-law relationship:
$$ E(t) = E_0 + A t^b $$
where \( E(t) \) is the error at time \( t \), \( E_0 \) is the initial error, and \( A \) and \( b \) are constants derived from regression. Extrapolating this model allows us to predict when errors will exceed acceptable limits, thereby estimating the reducer’s operational lifespan. This is particularly valuable for ensuring reliability in industrial applications where the rotary vector reducer is subjected to continuous use.
The versatility of our detection system extends to multi-station testing. By running two channels in parallel, we can compare different rotary vector reducer units or test the same unit under distinct conditions simultaneously. This capability accelerates the evaluation process and enhances statistical robustness. For instance, we conducted a comparative study on reducers with varying cycloid gear profiles. The results, summarized in the table below, highlight how gear design influences motion precision:
| Gear Profile Type | Average Positioning Error (mm) | Vibration Amplitude (mm) | Recommended Use |
|---|---|---|---|
| Standard Cycloid | 0.025 | 0.010 | General applications |
| Optimized Cycloid | 0.015 | 0.006 | High-precision robotics |
| Modified Tooth Shape | 0.020 | 0.008 | Heavy-load scenarios |
Such data-driven insights directly inform design choices, helping manufacturers tailor rotary vector reducers for specific performance requirements.
Looking ahead, the integration of machine learning algorithms could further enhance our system. By training models on historical data, we could predict failure modes or automatically classify reducer performance based on motion precision metrics. For example, a neural network could learn the patterns associated with worn components, enabling proactive maintenance. This would represent a significant advancement in the smart manufacturing of rotary vector reducers, aligning with Industry 4.0 trends.
In conclusion, the online detection system we developed offers a comprehensive solution for assessing the motion precision of rotary vector reducers. Through a combination of advanced sensors, precise data acquisition, and sophisticated software processing, we can monitor key parameters in real-time, analyze trends, and guide design optimizations. The system’s ability to simulate real-world conditions and perform parallel testing makes it a valuable tool for both research and industrial quality control. Our experiments have demonstrated that components like the cycloid gear, crankshaft, and gear shaft critically impact the overall performance of the rotary vector reducer. By continuing to refine this system, we aim to contribute to the development of high-performance, reliable reducers that meet the demanding needs of modern robotics and automation.