
In the field of industrial robotics, the rotary vector reducer serves as a critical component for joint actuation due to its compact size, high transmission ratio, and exceptional precision. As a researcher focused on precision manufacturing, I have developed an online vibration detection system to monitor the dynamic performance of the rotary vector reducer, aiming to address processing and assembly errors that arise during mass production. Vibration characteristics directly reflect these errors and significantly impact the repeatability, transmission stability, and lifespan of industrial robots. This study presents a comprehensive approach to online vibration detection under loaded inertia conditions, utilizing accelerometers, data acquisition hardware, and advanced software analysis to ensure product quality and enhance robotic performance.
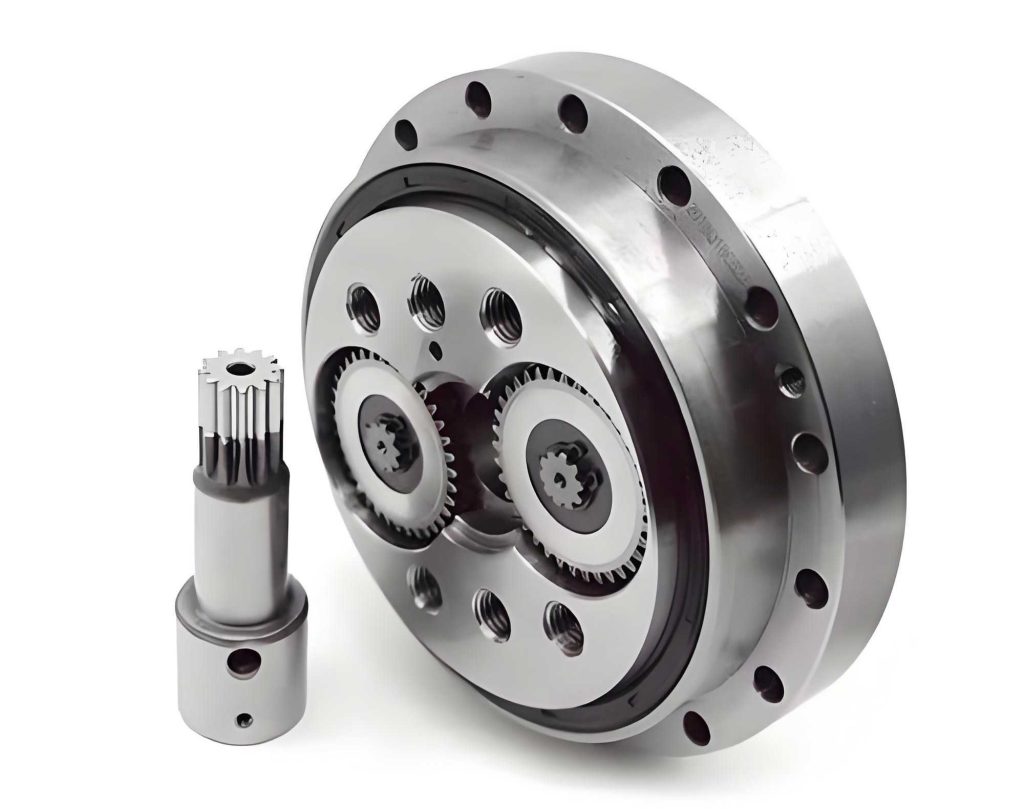
The rotary vector reducer operates as a two-stage reduction mechanism. The first stage involves a planetary gear system with an involute sun gear and planetary gears, while the second stage employs a cycloidal pin-wheel system with cycloidal discs and needle bearings. Understanding the transmission principles is essential for identifying vibration sources. The kinematic relationships can be expressed using the following formulas, where $n_i$ represents the rotational speed of component $i$, and $z_j$ denotes the number of teeth for gear $j$. For a fixed needle bearing housing, the transmission ratio is high, and the speeds are derived as:
$$ n_2 = n_4 = (z_4 – 1) n_6 $$
$$ n_3 = n_0 $$
Here, $n_2$ and $n_4$ correspond to the rotation speeds of the planetary gear and cycloidal disc公转, respectively, while $n_3$ and $n_0$ relate to the planetary gear公转 and cycloidal disc自转. These equations form the basis for calculating characteristic frequencies associated with vibration excitation sources in the rotary vector reducer.
The vibration excitation in a rotary vector reducer primarily stems from three categories: rotational unbalance due to misalignment, meshing forces from gear interactions, and unbalanced forces from the crank shaft. The frequencies for these sources are calculated as follows. The rotational excitation frequency $f_m$ is given by:
$$ f_m = \frac{n}{60} $$
where $n$ is the rotational speed in rpm. The meshing excitation frequency $f_b$ is derived from:
$$ f_b = \frac{n z}{60} $$
where $z$ is the number of teeth on the engaging gear. Additionally, the crank shaft’s unbalanced force introduces a distinct frequency component. Based on these formulas, I have computed the characteristic frequencies for a specific model, the RV-20E rotary vector reducer, with parameters: sun gear teeth $z_1 = 9$, planetary gear teeth $z_2 = 27$, cycloidal disc teeth $z_3 = 39$, and needle bearing housing teeth $z_4 = 40$. The results are summarized in the table below, which illustrates how these frequencies vary with input speeds from 400 to 1200 rpm.
| Excitation Source | Frequency (Hz) at 400 rpm | Frequency (Hz) at 800 rpm | Frequency (Hz) at 1000 rpm | Frequency (Hz) at 1200 rpm |
|---|---|---|---|---|
| Input Shaft Rotational Frequency | 6.66 | 13.33 | 16.66 | 20.00 |
| Crank Shaft Excitation Frequency | 1.22 | 2.43 | 3.05 | 4.57 |
| Needle Bearing Housing Frequency | 0.11 | 0.21 | 0.27 | 0.32 |
| Planetary Gear自转 Frequency | 2.14 | 4.29 | 5.37 | 6.45 |
| Cycloidal Disc自转 Frequency | 0.06 | 0.11 | 0.14 | 0.17 |
| Planetary Gear Meshing Frequency | 58.02 | 116.03 | 145.04 | 174.05 |
| Cycloidal Disc Meshing Frequency | 47.60 | 95.21 | 119.01 | 142.82 |
This table highlights that meshing frequencies, particularly from the planetary gears, dominate the high-frequency range, making them critical for vibration analysis in the rotary vector reducer. The second category of excitation sources, involving gear meshing, consistently produces the highest frequencies, which can lead to signal distortion and complicate time-domain analysis. Therefore, frequency-domain techniques like Fast Fourier Transform (FFT) become indispensable for diagnosing errors in the rotary vector reducer.
The online vibration detection system I designed comprises four main modules: motion control, simulated robot motion, data acquisition, and upper computer processing. Each module plays a vital role in replicating real-world operating conditions for the rotary vector reducer. The motion control module utilizes a robotic control cabinet and servo drives to regulate input speeds and travel ranges, allowing for variable testing scenarios. The simulated robot motion module mimics the joint assembly of an industrial robot by mounting the rotary vector reducer on a base, attaching a cantilever arm with a simulated load to the output, and subjecting it to inertial loading. This setup ensures that the rotary vector reducer experiences realistic dynamic stresses during testing.
The data acquisition module incorporates high-sensitivity accelerometers to capture vibration signals from the rotary vector reducer housing. I selected PCB 333B40 ICP accelerometers due to their wide frequency response (0.5 to 3000 Hz), high resolution (0.00005 g rms), and robustness in harsh environments. These sensors are mounted orthogonally on the housing to measure tangential and radial vibrations, connected via coaxial cables to a DEWE-43A transient data acquisition device. This device features 24-bit AD resolution and synchronous sampling across channels, ensuring accurate signal capture for the rotary vector reducer. The upper computer module employs DEWESOFT software for real-time data visualization, parameter setting, and advanced analysis, alongside a custom MFC application for motion precision monitoring. Together, these modules enable comprehensive vibration detection for the rotary vector reducer, facilitating error feedback during production.
The design of the acquisition system focuses on precision and reliability. The accelerometers, with a range of ±10 g peak and sensitivity of 500 mV/g, are ideal for detecting subtle vibrations typical in high-precision rotary vector reducers. The data acquisition device supports multiple input types and ensures minimal noise interference, while the software provides tools for time-domain and frequency-domain processing. This integrated system allows for continuous monitoring of the rotary vector reducer under various operational conditions, essential for quality control in manufacturing.
In my experimental investigation, I conducted vibration tests on an RV-20E rotary vector reducer under loaded inertia conditions. The setup involved attaching a 500 mm cantilever arm with a 40 kg simulated load to the output, simulating a robot joint’s dynamic behavior. The input speed was varied from 300 to 1800 rpm in increments of 100 rpm, with vibration data recorded at each step. Accelerometers placed on the housing captured signals in the X (radial) and Y (tangential) directions, which were then processed to assess the vibration performance of the rotary vector reducer. The goal was to correlate vibration levels with potential processing and assembly errors, using characteristic frequencies as diagnostic tools.
The vibration acceleration time history revealed distinct patterns. For instance, at input speeds of 400 rpm and 800 rpm, the time-domain signals exhibited a beat phenomenon, with two beats corresponding to the two eccentric shafts in the rotary vector reducer. This observation aligns with the structural design of the reducer, where eccentric motion induces periodic variations in vibration amplitude. The time-domain plots showed sinusoidal-like waveforms with modulations, indicating the influence of meshing and rotational components on the rotary vector reducer’s dynamic response.
To quantify the vibration characteristics, I analyzed the root-mean-square (RMS) acceleration values across different speeds. The vibration characteristic curve, plotting acceleration against input speed, demonstrated that vibration levels generally increased with speed, peaking around 1200 rpm. This trend is consistent with theoretical expectations, as higher speeds amplify dynamic forces in the rotary vector reducer. The acceleration values remained below 0.1 G, adhering to industry standards for acceptable vibration in precision reducers. The curve can be modeled empirically using a polynomial fit, such as:
$$ a(s) = c_0 + c_1 s + c_2 s^2 $$
where $a(s)$ is the vibration acceleration in G, $s$ is the input speed in rpm, and $c_i$ are coefficients derived from experimental data. This relationship helps in setting tolerance limits for the rotary vector reducer during production testing.
For deeper insight, I applied FFT to transform time-domain signals into frequency spectra. At 1200 rpm, the FFT spectra for both X and Y directions displayed prominent peaks at specific frequencies. A dominant peak near 20 Hz matched the input shaft rotational frequency, indicating that misalignment or unbalance in the input stage contributed significantly to vibration in the rotary vector reducer. Another peak around 170 Hz coincided with the planetary gear meshing frequency, confirming that gear interactions are a primary excitation source. The spectra also showed smaller peaks at other characteristic frequencies, such as those of the crank shaft and cycloidal disc, providing a comprehensive vibration fingerprint of the rotary vector reducer. The FFT analysis enabled precise identification of error sources, such as tooth profile errors or assembly misalignments, by comparing measured frequencies with theoretical values from the table above.
The integration of online vibration detection into the manufacturing process offers substantial benefits. By continuously monitoring the rotary vector reducer during testing, I can quickly identify outliers in vibration performance, trigger adjustments in machining or assembly, and reduce defect rates. The use of DEWESOFT software facilitates automated analysis, including real-time FFT and trend plotting, making the system efficient for high-volume production of rotary vector reducers. Moreover, the data collected can be stored for long-term quality tracking, supporting iterative improvements in design and process for the rotary vector reducer.
In conclusion, the online vibration detection technology I developed provides a robust solution for ensuring the quality and reliability of rotary vector reducers in industrial robotics. Through simulated loading, precise sensor measurements, and advanced frequency analysis, this approach effectively feeds back processing and assembly errors, enabling corrective actions that enhance product consistency. The rotary vector reducer’s vibration characteristics, when monitored in real-time, serve as a valuable indicator of dynamic performance, ultimately contributing to improved robot accuracy and longevity. Future work may involve integrating machine learning algorithms for predictive maintenance and expanding the system to other reducer types, but the core methodology established here remains pivotal for advancing the manufacturing of high-precision rotary vector reducers.