
The pursuit of precision, compactness, and high load capacity in modern robotics and automation has positioned the rotary vector reducer as a critical component. This type of reducer, characterized by its two-stage transmission combining a planetary gear train and a cycloidal pin-wheel mechanism, offers superior stiffness, high transmission accuracy, and smooth operation. However, the operational longevity and stability of the rotary vector reducer are inherently challenged by dynamic excitations. While traditional modal analysis provides foundational insights into natural frequencies and mode shapes, it often falls short of characterizing the real-world vibrational environment where excitations are frequently random in nature. These random vibrations, stemming from variable loads, manufacturing imperfections, and operational transients, can induce unexpected stress concentrations and fatigue, ultimately compromising the reliability of the rotary vector reducer. This article presents an integrated simulation methodology to assess the influence of random vibration on a rotary vector reducer, combining multibody dynamics, finite element analysis, and probabilistic spectral estimation to evaluate stress distributions and safety margins under operational conditions.
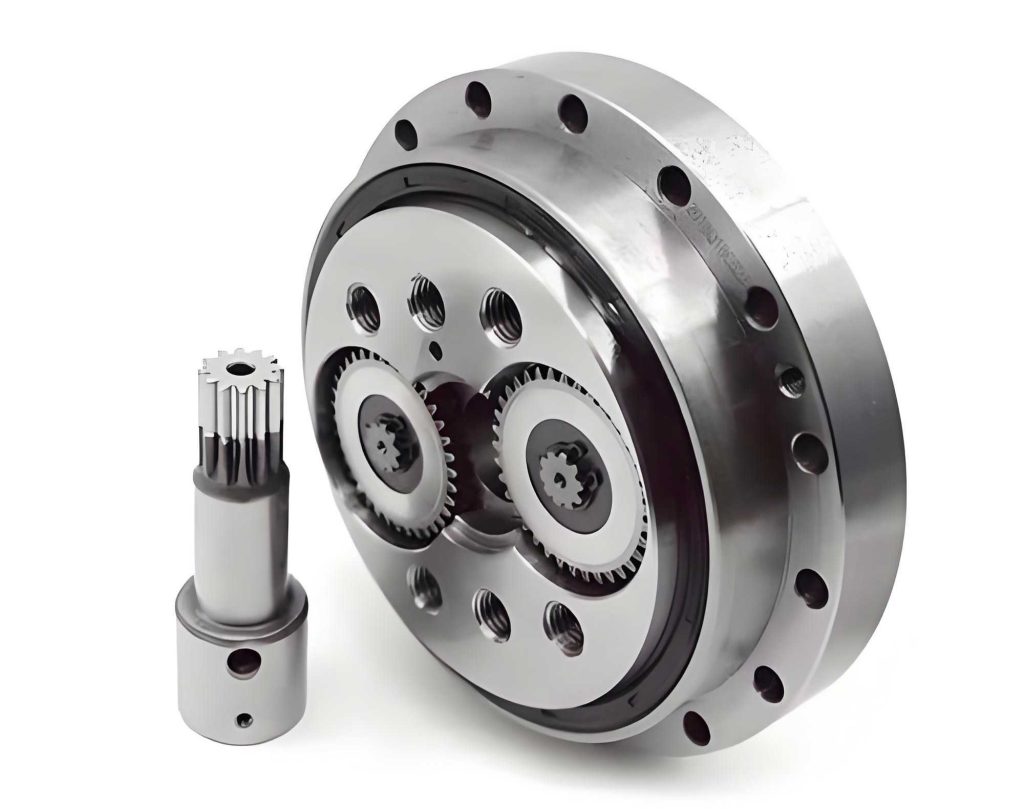
The core of the methodology begins with a detailed theoretical understanding and accurate geometrical representation of the rotary vector reducer. The primary components include an input shaft (sun gear), two spur gears (planet gears) in the high-speed stage, crankshafts, cycloidal discs, pinwheels, and the output disc. The power flow involves the input shaft driving the two spur gears, which in turn rotate the crankshafts. The eccentric motion of the crankshafts drives the cycloidal discs, engaging with the stationary pinwheels to produce a high reduction ratio at the output disc. A three-dimensional model of the rotary vector reducer is constructed, capturing all critical interfaces and assembly relations. The fundamental parameters for the specific model under investigation are summarized in the table below.
| Parameter Name | Symbol | Unit | Value |
|---|---|---|---|
| Input Shaft Speed | n1 | r/min | 1530 |
| Input Power | P | kW | 0.65 |
| Spur Gear Teeth | z2 | – | 57 |
| Input Shaft Gear Teeth | z1 | – | 15 |
| Cycloidal Disc Teeth | zc | – | 39 |
| Pinwheel Teeth | zp | – | 40 |
| Total Reduction Ratio | – | – | 153 |
The next critical phase involves extracting the dynamic response of the system under motion. The assembled 3D model of the rotary vector reducer is imported into a multibody dynamics simulation environment. Appropriate materials are assigned to each component to reflect their physical properties, such as G20CrMo for the cycloidal discs and 40Cr for the input shaft and spur gears. Joints and contact forces are meticulously defined to replicate the actual kinematic and force transmission paths within the rotary vector reducer. A rotational velocity of 1530 rpm is applied to the input shaft. The primary output from this kinematic simulation is the acceleration time-history of key components, specifically the center of mass acceleration of one of the spur gears in the radial (X) and tangential (Y) directions. These acceleration signals, which contain the dynamic response of the system to the prescribed motion and internal contact interactions, serve as the raw data representing the operational vibration of the rotary vector reducer. They are not deterministic but exhibit characteristics of a random process due to the complex, time-varying meshing contacts.
Prior to delving into random vibration analysis, a modal analysis of the rotary vector reducer’s input stage assembly is imperative. The natural frequencies of the structure dictate its propensity to resonate when excited by specific frequency content present in the operational environment. The finite element model is constructed, ensuring consistent material properties and contact definitions with the dynamics model. After applying appropriate constraints, the first six natural frequencies of the assembly are solved. The results are tabulated below.
| Mode Number | Frequency (Hz) |
|---|---|
| 1 | 668.9 |
| 2 | 910.5 |
| 3 | 936.0 |
| 4 | 984.5 |
| 5 | 1796.4 |
| 6 | 2060.0 |
The acceleration signals obtained from the dynamics simulation are finite-duration samples of a presumably stationary and ergodic random process. To characterize their frequency-domain properties for random vibration analysis, we employ Power Spectral Density (PSD). The PSD describes how the power of a signal is distributed over frequency and is the fundamental input for a frequency-domain random vibration analysis. The first step involves estimating the autocorrelation function $$ R_x(\tau) $$ of the acceleration signal $$ x(t) $$, which measures the similarity between the signal and a time-lagged version of itself:
$$ R_x(\tau) = \lim_{T \to \infty} \frac{1}{T} \int_{-T/2}^{T/2} x(t) x(t + \tau) dt $$
In practice, with a finite sample length $$ T $$, we compute an estimate of the autocorrelation. The computed autocorrelation functions for the radial (X) and tangential (Y) acceleration signals typically show a peak at $$ \tau = 0 $$ and decay, but irregularities may indicate noise. To improve the spectral estimate, a windowing function (e.g., Hamming window) is applied to the autocorrelation sequence to reduce spectral leakage. The PSD function $$ S_x(\omega) $$ is then obtained via the Fourier Transform of the windowed autocorrelation function, establishing the Wiener-Khinchin theorem relation:
$$ S_x(\omega) = \int_{-\infty}^{\infty} w(\tau) R_x(\tau) e^{-i\omega \tau} d\tau $$
Applying this spectral estimation technique to the acceleration data from the rotary vector reducer simulation yields the PSD curves. These curves reveal distinct peaks at specific frequencies, indicating high energy content that could potentially excite the structural modes of the rotary vector reducer. For the purpose of random vibration analysis, the frequency-PSD value pairs at these peak points are extracted to define the input excitation profile. The table below summarizes the critical PSD peaks for both directional accelerations.
| Frequency (Hz) | PSD in X Dir. (m²/s³) | PSD in Y Dir. (m²/s³) |
|---|---|---|
| 200 | 34.48 | 33.81 |
| 370 | 40.22 | 39.22 |
| 670 | 36.13 | 35.15 |
| 1100 | 26.65 | 25.77 |
| 1310 | 27.08 | 26.59 |
| 1470 | 27.54 | 26.57 |
This PSD profile, derived directly from the operational simulation of the rotary vector reducer, forms the basis for the subsequent random vibration analysis. It represents a more realistic excitation spectrum compared to assuming a flat or idealized profile.
The extracted PSD table is imported as the base excitation input into a Random Vibration analysis module within a finite element environment. The finite element model of the rotary vector reducer input stage is subjected to this acceleration PSD profile. The analysis solves for the statistical stress response, typically outputting results like 1-sigma or 3-sigma stress values, corresponding to the standard deviation levels of the response. Three key metrics are evaluated to assess the impact of random vibration on the rotary vector reducer:
1. Stress at the Gear Meshing Region: The tooth root and contact regions of the spur gear are primary locations for stress concentration. Paths are defined along the meshing segments of both the upper and lower spur gear teeth. The random vibration analysis reveals the distribution of equivalent (von-Mises) stress along these paths. A critical finding is that the maximum equivalent stress values for the upper and lower spur gear meshing paths are not equal. This asymmetry, induced by the random vibrational excitation, indicates an uneven load distribution between the two power paths in the planetary stage of the rotary vector reducer, which could lead to accelerated wear or failure in one of the gears.
2. Circumferential Stress on the Input Shaft Gear: To understand vibrational stability, the stress variation around the circumference of the input shaft gear is investigated. A circular path is defined around the gear’s root diameter. The resulting stress plot shows peaks at the meshing locations with the two spur gears. Importantly, the peak stress values at these two diametrically opposite meshing points are not identical. This further corroborates the finding that random vibration disrupts the theoretical force symmetry in the rotary vector reducer, potentially causing uneven loading and reduced operational smoothness.
3. System-Level Normal Stress and Safety Margin: The overall stress state of the assembly under random vibration is examined by evaluating the normal stress in critical global directions (e.g., along the axis connecting the input and spur gear centers, and the radial direction). The 3-sigma stress results, representing a 99.7% probability level, are considered for a conservative assessment. The maximum normal stresses in the critical directions are identified. The final step in reliability assessment is the calculation of the Safety Margin (MS). The total maximum equivalent stress $$ \sigma_{max}^{total} $$ in a component is the root-sum-square combination of the stress from deterministic loads (e.g., bending stress from torque transmission) and the 3-sigma random vibration stress. The bending stress from torque can be calculated using standard gear load capacity formulas (e.g., based on ISO 6336 or AGMA standards). For a rotary vector reducer component made of a material like 40Cr, the allowable stress $$ [\sigma] $$ is known. The safety margin is then given by:
$$ MS = \frac{[\sigma]}{n \cdot \sigma_{max}^{total}} – 1 $$
where $$ n $$ is the designated safety factor. A positive MS indicates a reliable design. In this analysis, considering both the deterministic bending stress from the rated torque and the 3-sigma random vibration stress, the calculated safety margin for critical components in the rotary vector reducer was found to be greater than zero, confirming structural integrity under the considered random excitation. However, the observed stress asymmetries highlight potential areas for improvement.
This integrated methodology provides a comprehensive framework for analyzing the effects of random vibration on a rotary vector reducer. By deriving the excitation PSD from operational dynamics simulation and applying it in a finite element-based random vibration analysis, we move beyond traditional deterministic or modal analyses. The key conclusions are:
- Random vibration excitations inherent in the operation of a rotary vector reducer can lead to asymmetric stress distributions in theoretically symmetric components, such as the meshing stresses on paired spur gears and circumferential stresses on the input gear.
- This asymmetry, quantified through path-dependent stress analysis, reveals a potential mechanism for uneven wear and reduced operational stability that might not be predicted by static or deterministic dynamic analyses alone.
- The proposed workflow—linking multibody dynamics for excitation characterization, spectral estimation for PSD derivation, and finite element analysis for stress response—enables a more realistic assessment of the reliability of a rotary vector reducer.
- The calculation of the safety margin, incorporating both deterministic operational stresses and statistically quantified random vibration stresses, offers a robust criterion for evaluating the design’s adequacy.
This approach provides designers and engineers with a powerful tool to proactively address vibrational reliability in the complex, high-precision environment of the rotary vector reducer, guiding optimization in geometry, assembly tolerances, or material selection to mitigate the adverse effects of random dynamic loads.