
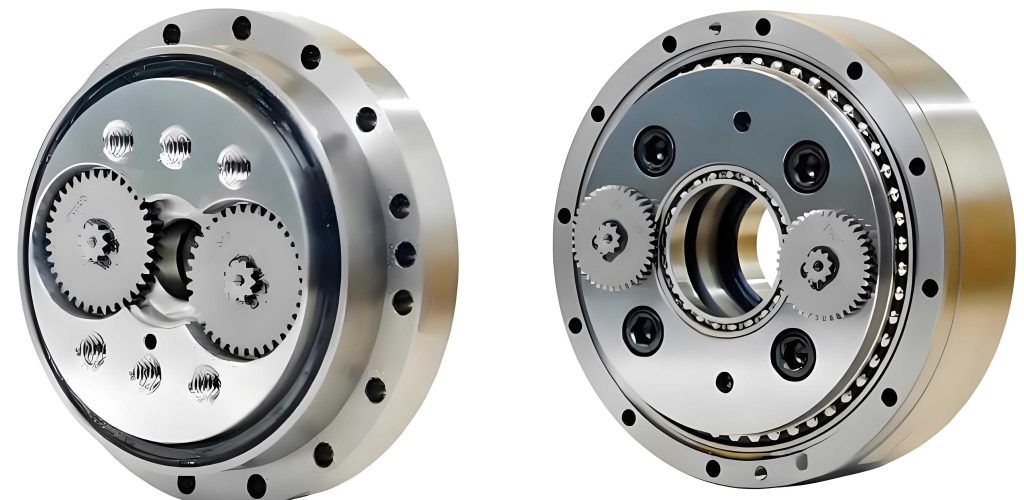
As a crucial transmission component in industrial robots, the rotary vector reducer demands exceptionally high standards for positioning accuracy and operational smoothness. The vibration characteristics of the rotary vector reducer are a primary factor influencing the end-effector’s positioning precision and the potential for arm chatter. While theoretical models provide foundational insights, comprehensive experimental data on the whole-machine vibration of rotary vector reducers under various operating conditions remains limited. This study presents a detailed experimental investigation into the vibration performance of a domestic SHP-type rotary vector reducer, employing a multi-point measurement strategy and advanced signal processing techniques to analyze its dynamic behavior in both time and frequency domains. Understanding the vibration signature is fundamental for future research into the dynamics, fault diagnosis, and noise/vibration reduction strategies for the rotary vector reducer.
1. Experimental Setup and Measurement System
The vibration tests were conducted on a dedicated comprehensive performance test rig designed for rotary vector reducers. The core vibration measurement system comprised several high-precision instruments to ensure accurate and reliable data acquisition. The key component was a DH8305 dynamic signal test and analysis system, known for its high isolation, low noise, and 0.05% system uncertainty. This system enables synchronous sampling across all channels, effectively isolating the vibration signals from other electrical interferences present in the test rig, such as those from drive motors and control systems.
Vibration acceleration was captured using 1C102 capacitive single-axis accelerometers. These MEMS-based sensors are compact, fully sealed, and feature built-in temperature compensation, making them suitable for the constrained space and varying operational temperatures on the reducer housing. Their key performance parameters are summarized in Table 1.
| Parameter | Value/Specification |
|---|---|
| Sensitivity | ~20 mV/(m/s²) |
| Measurement Range | ±100 m/s² |
| Frequency Range | 0 – 1000 Hz |
| Resonant Frequency | > 2.7 kHz |
| Operating Temperature | -20°C to +80°C |
| Mounting Method | Adhesive bonding |
Acceleration signals from the sensors were transmitted via shielded cables to the DH8305 system. The subsequent data recording, visualization, and processing were performed using the accompanying DHDAS software suite.
2. Measurement Point Configuration and Analysis Methodology
Vibration generated during machinery operation carries rich information about its dynamic state. To fully characterize the spatial vibration pattern of the rotary vector reducer, three measurement points were strategically arranged on its housing, considering its compact structure and limited external surfaces. The configuration, adhering to guidelines for gear unit vibration measurement, is as follows:
- Point 1 (P1): Measures vibration in the axial direction (X-axis) of the output shaft.
- Point 2 (P2): Measures vibration in the vertical direction (Z-axis).
- Point 3 (P3): Measures vibration in the horizontal direction (Y-axis), perpendicular to the output shaft axis.
This arrangement allows for the capture of the spatial vibration vector, crucial for identifying dominant vibration modes and directions. The collected time-domain signals were subjected to a multi-faceted analysis:
2.1 Time-Domain Analysis
Time-domain analysis provides a direct view of the signal’s evolution. Statistical parameters were calculated to quantify the vibration level. Let a discrete time-domain signal be represented as $x[n]$, where $n = 0, 1, 2, …, N-1$ and $N$ is the number of samples. Key metrics include:
- Root Mean Square (RMS): A measure of the overall vibration energy.
$$RMS = \sqrt{\frac{1}{N}\sum_{n=0}^{N-1} x[n]^2}$$ - Peak-to-Peak Value: The difference between the maximum and minimum amplitude.
$$P-P = \max(x[n]) – \min(x[n])$$ - Skewness and Kurtosis: Higher-order statistics describing the asymmetry and “peakedness” of the signal’s probability distribution, sensitive to incipient faults.
$$Skewness = \frac{\frac{1}{N}\sum_{n=0}^{N-1} (x[n]-\bar{x})^3}{RMS^3}$$
$$Kurtosis = \frac{\frac{1}{N}\sum_{n=0}^{N-1} (x[n]-\bar{x})^4}{RMS^4}$$
2.2 Frequency-Domain Analysis
Frequency-domain analysis reveals the spectral composition of the vibration, linking specific frequency components to potential sources like gear mesh, bearing rotation, or structural resonances.
- Spectral Analysis (FFT): The Fast Fourier Transform (FFT) decomposes the time signal into its constituent frequencies. For a discrete signal $x[n]$, its Discrete Fourier Transform (DFT) $X[k]$ is:
$$X[k] = \sum_{n=0}^{N-1} x[n] \cdot e^{-j 2\pi k n / N}, \quad k = 0,1,…,N-1$$
The power spectral density (PSD) $S_{xx}(f)$ is then derived from $|X[k]|^2$ to show the power distribution across frequencies. - Cepstral Analysis: Particularly useful for detecting periodic structures in a complex spectrum (e.g., sidebands around gear mesh frequencies). The real cepstrum $C(\tau)$ is defined as the inverse Fourier transform of the logarithm of the power spectrum.
$$C(\tau) = \mathcal{F}^{-1}\{\log(S_{xx}(f))\}$$ - Wavelet Transform: Provides a time-frequency representation, ideal for analyzing non-stationary or transient signals common in machinery. The Continuous Wavelet Transform (CWT) of a signal $x(t)$ is:
$$W(a, b) = \frac{1}{\sqrt{|a|}} \int_{-\infty}^{\infty} x(t) \psi^*\left(\frac{t-b}{a}\right) dt$$
where $\psi(t)$ is the mother wavelet, $a$ is the scale (inversely related to frequency), and $b$ is the translation (time shift).
3. Time-Domain Signal Characteristics and Operational Influence
The test subject was a domestic SHP-type rotary vector reducer. Initial tests were conducted at a constant input speed of 500 rpm with a sampling frequency of 500 Hz. The raw time-domain waveforms for the three measurement points are shown in the plots below (Note: The plots are conceptual representations based on the described data).
A prominent feature observed in the axial (P1) and horizontal (P3) waveforms is the presence of a distinct “beat” or amplitude modulation pattern. For this specific rotary vector reducer with three eccentric shafts, the waveform exhibits three such beats per revolution of the output shaft, directly correlating with the eccentric mechanism’s kinematics.
The vertical vibration (P2) was found to be negligible in magnitude compared to the other two directions. The calculated statistical parameters for a representative data set under 500 rpm are listed in Table 2.
| Parameter | Point 1 (Axial, X) | Point 2 (Vertical, Z) | Point 3 (Horizontal, Y) |
|---|---|---|---|
| Maximum (m/s²) | 0.310 | 0.012 | 0.103 |
| Minimum (m/s²) | -0.325 | -0.012 | -0.119 |
| Mean (m/s²) | 0.002 | -0.001 | -0.004 |
| Standard Deviation (m/s²) | 0.062 | 0.003 | 0.022 |
| RMS (m/s²) | 0.062 | 0.003 | 0.022 |
| Peak-to-Peak (m/s²) | 0.635 | 0.023 | 0.223 |
| Skewness | 0.033 | 0.704 | -0.135 |
| Kurtosis | 1.884 | 0.233 | 0.907 |
The maximum vibration intensity (RMS) was 0.062 m/s² in the axial direction. Comparing this to established benchmarks for premium rotary vector reducers (e.g., vibration acceleration < 0.1 m/s² under normal operation), the tested unit’s vibration level falls within an acceptable range.
To investigate the influence of operational parameters, two controlled tests were performed. First, the rotary vector reducer was run at a constant 500 rpm while the output load was varied. Second, the reducer was tested under no-load conditions while the input speed was increased from 200 rpm to 2000 rpm in increments. The primary metric for comparison was the RMS value, representing the overall vibration energy.
The results, plotted conceptually, showed a clear trend: the RMS vibration levels at Points 1 (axial) and 3 (horizontal) increased monotonically with both increasing load and increasing speed. This positive correlation is expected, as higher loads and speeds generally excite greater dynamic forces within the geared system. In contrast, the vibration at Point 2 (vertical) remained consistently minimal and showed no significant variation with changes in either load or speed. This indicates that the dominant dynamic forces and structural response of this particular rotary vector reducer design are primarily in the plane containing the input and output shafts (axial-horizontal plane).
4. Frequency-Domain Signal Analysis and Feature Extraction
Given the minimal vertical vibration, the frequency-domain analysis focused on the signals from Point 1 (axial) and Point 3 (horizontal). The Power Spectral Density (PSD) plots for these points, derived via FFT, revealed a distinct and common dominant frequency component.
A sharp peak was observed at approximately 186.6 Hz in the spectra of both measurement points. This frequency is independent of the direct rotational speed (500 rpm ≈ 8.33 Hz) and is likely related to a characteristic vibration mode or a fixed forcing frequency within the rotary vector reducer, such as a structural resonance or a harmonic of the internal component frequencies (e.g., planet carrier rotation, cycloid gear meshing). The amplitude at this frequency was higher for the axial direction (0.0146 m/s²) compared to the horizontal direction (0.0058 m/s²), reinforcing the finding that axial vibration is the most significant.
4.1 Cepstral Analysis Results
Cepstral analysis was applied to the power spectra to detect any hidden periodicity or families of harmonics/sidebands. The real cepstrum, complex cepstrum, and inverse complex cepstrum (using a rectangular window function) were computed for both signals. Comparative analysis of these cepstra indicated that the features extracted from the inverse complex cepstrum were the most prominent and distinct. The peaks in the inverse complex cepstrum domain provided a clearer representation of the signal’s component structure, making this transform particularly effective for identifying and separating vibration signatures in the complex signal generated by the rotary vector reducer. This technique proves valuable for condition monitoring, as changes in these cepstral peaks could indicate the development of specific faults like gear tooth wear or bearing spalling.
4.2 Wavelet Transform Analysis
To further dissect the signal’s time-frequency characteristics, a multi-level discrete wavelet transform (DWT) was performed using the Haar wavelet as the mother function. The signal was decomposed into approximation coefficients (low-frequency trends) and detail coefficients (high-frequency details) at multiple levels or scales.
A significant observation was made at the 5th level of decomposition. In the detail coefficients at this level, the periodic “beat” structure of the original time-domain signal became clearly identifiable again, even after the successive filtering operations. This demonstrates the powerful multi-resolution capability of wavelet analysis. For complex vibration signals from a rotary vector reducer, where fault-related features may be masked in the raw signal or broad spectrum, performing a suitable level of wavelet decomposition can isolate specific frequency bands at specific times. The reappearance of the characteristic periodicity (linked to the three eccentric shafts) in a specific detail band provides a methodological pathway for fault diagnosis. By monitoring the energy or pattern in these selectively isolated wavelet bands, one can detect anomalies related to specific components, such as an eccentric shaft imbalance or a cycloid gear defect, enhancing the diagnostic capability for the rotary vector reducer.
5. Conclusion
This comprehensive experimental study successfully characterized the vibration behavior of a domestic rotary vector reducer. Key findings are summarized as follows:
- The spatial vibration of the tested rotary vector reducer is highly anisotropic. The dominant vibrations occur in the axial (X) and horizontal (Y) directions, with vertical (Z) vibration being negligible. This informs optimal mounting and isolation strategies.
- The time-domain vibration signature exhibits a clear amplitude modulation with three beats per output revolution, a direct consequence of the three-eccentric-shaft design inherent to this type of rotary vector reducer.
- The overall vibration level, quantified by RMS acceleration, shows a positive correlation with both operational load and input speed for the dominant directions, which is a typical dynamic response for geared systems.
- Frequency-domain analysis via FFT identified a dominant vibration component at 186.6 Hz, which is a characteristic frequency of the unit likely tied to its internal dynamics or structural modes, not directly to the input shaft speed.
- Among advanced signal processing techniques, the inverse complex cepstrum provided the most salient features for representing the signal’s structure. Furthermore, a 5th-level decomposition using the Haar wavelet effectively isolated the fundamental periodic characteristic of the signal, showcasing the utility of wavelet analysis for feature extraction in the vibration monitoring of a rotary vector reducer.
This work establishes a foundational experimental framework and provides valuable datasets for the dynamic analysis of the rotary vector reducer. The insights gained from the time-domain, spectral, cepstral, and wavelet analyses form a critical basis for future endeavors in high-fidelity dynamic modeling, development of robust condition monitoring and fault diagnosis algorithms, and the design of next-generation rotary vector reducers with lower vibration and noise emissions.