
In the field of precision motion control and power transmission, particularly within demanding sectors such as aerospace, robotics, and advanced instrumentation, the strain wave gear reducer stands out for its exceptional characteristics. This unique mechanism, also known as a harmonic drive, offers unparalleled advantages including high reduction ratios in a compact package, near-zero backlash, high torque capacity, and concurrent multi-tooth engagement leading to smooth operation. My focus lies on the critical aspect of reliability and life assessment for these components. Given their deployment in mission-critical applications, a failure can lead to severe operational disruption, significant financial loss, or compromise to safety. Therefore, developing robust methodologies for predicting the fatigue life of a strain wave gear is of paramount importance for both designers and end-users.
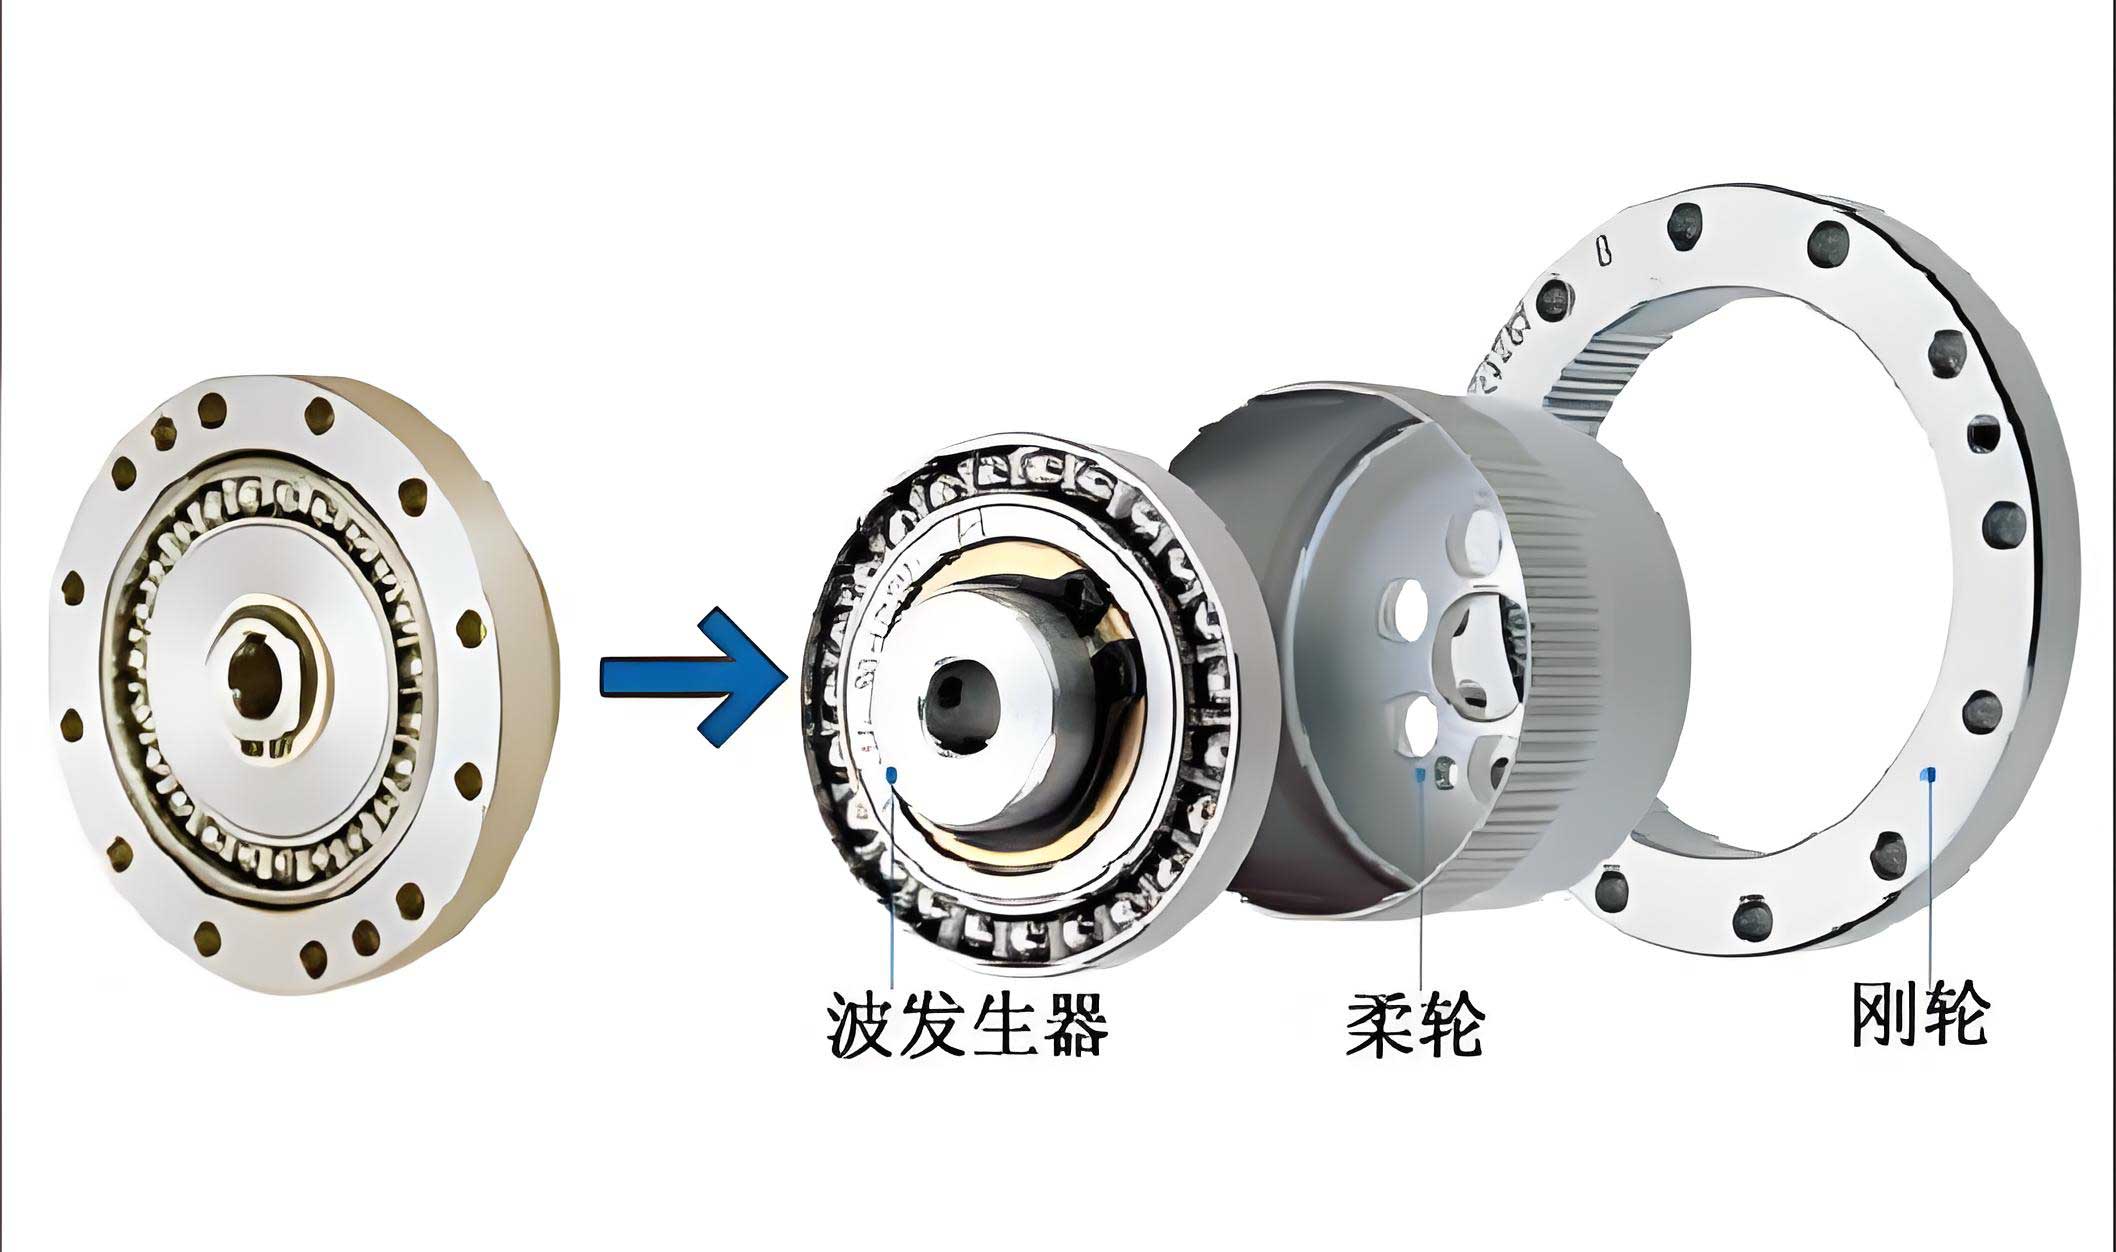
The operational principle of a strain wave gear revolves around controlled elastic deformation. Unlike conventional rigid gear systems, it comprises four primary components: a wave generator (an elliptical cam or a multi-lobed bearing), a flexspline (a thin-walled, flexible external gear), a circular spline (a rigid internal gear), and a dedicated柔性轴承 (flexible bearing) that facilitates the deformation. The wave generator, typically the input, deforms the flexspline into an elliptical shape. This deformation causes the teeth of the flexspline to engage with those of the circular spline at two diametrically opposite regions along the major axis of the ellipse, while they completely disengage at the minor axis. A slight difference in the number of teeth between the flexspline and the circular spline (usually 2 teeth) results in a significant relative rotation with each revolution of the wave generator. The intricate interplay of forced deformation and dynamic meshing forces subjects the flexspline to a complex, cyclic state of stress, making its fatigue endurance the primary determinant of the system’s operational lifespan.
A thorough investigation into the failure modes of a strain wave gear reveals several potential mechanisms. Understanding these is the first step towards targeted life prediction. The predominant and most critical failure mode is the fatigue fracture of the flexspline. This thin-walled cup or hat-shaped component undergoes millions of stress cycles during its service life. Cracks typically initiate at points of high-stress concentration, most commonly in the dedendum region (tooth root fillet) of the flexspline tooth, often near the open end of the cup. These cracks can then propagate through the wall thickness and along the length of the cup, sometimes at an approximate 45-degree angle relative to the axis, especially under conditions of reversing torque. Other potential failure modes include wear of the tooth flanks, which can degrade transmission accuracy and increase backlash; sliding or loss of synchronization between components; plastic deformation of the tooth surfaces under excessive overload; and fatigue failure of the specialized柔性轴承 supporting the wave generator. However, for the purpose of a foundational life assessment simulation, the high-cycle fatigue of the flexspline constitutes the primary limiting factor and is the focus of my analysis.
Assessing the fatigue life of the flexspline analytically is exceptionally challenging due to its complex geometry and the non-linear, contact-dominated loading conditions. Traditional empirical formulas, often derived from simplified ring or shell theories, rely on numerous assumptions about load distribution and boundary conditions. For instance, the deformation force \( F \) required to achieve a specific radial displacement \( \omega_0 \) in the flexspline, modeled as an elastic ring, can be approximated using series solutions based on elastic theory. One formulation for a four-force deformation pattern, with forces applied at an angle \( \beta \) from the major axis, is given by:
$$F = \frac{\pi E I_x \omega_0}{4 r^3 \sum_{n=2,4,6…}^{\infty} \frac{\cos(n\beta)}{n^2 – 1}}$$
where \( E \) is the modulus of elasticity, \( I_x \) is the combined moment of inertia of the flexspline cup wall and the equivalent tooth section, and \( r \) is a reference radius (often the inner radius of the cup). While such formulas provide initial estimates, they lack the spatial resolution to identify local stress concentrations accurately. Experimental methods using strain gauges can validate specific points but cannot provide a full-field stress map. This is where the finite element method (FEM) becomes indispensable. It allows for a detailed, three-dimensional analysis of the stress and strain fields within the entire flexspline under simulated operational loads.
My simulation approach leverages the synergistic power of three-dimensional computer-aided design (CAD) and advanced finite element analysis (FEA) software, specifically using ANSYS as the platform. The process is methodical and involves several key stages, from geometric simplification to post-processing for life estimation. A significant challenge in creating an efficient yet accurate finite element model of a strain wave gear flexspline is the sheer number of teeth. Modeling every tooth with precise involute or S-shaped profiles leads to an enormous number of elements, making nonlinear contact analysis and subsequent fatigue calculations computationally prohibitive for initial life assessments. Therefore, a rational simplification is necessary.
A widely accepted simplification technique replaces the toothed rim section of the flexspline with an equivalent smooth cylinder of increased thickness. The thickness of this equivalent cylinder is calculated to have approximately the same radial bending stiffness as the actual toothed section. An empirical formula for this equivalent thickness \( h_{eq} \) is often used:
$$h_{eq} = 1.6 \sqrt{S_1}$$
where \( S_1 \) is the radial distance between the flexspline’s dedendum circle and the inner wall of the cup. This simplification effectively transforms the complex gear mesh loading into distributed pressures or boundary conditions applied to this equivalent rim, allowing the analysis to focus on the global stress state in the cup body, which is the primary location for catastrophic fatigue failure. The geometry for the cup body, including the critical fillet radii at the junction between the cup wall and the diaphragm or flange, must be modeled accurately as these are potential stress concentrators.
Defining the correct boundary conditions and loads is crucial for a representative simulation. The model must reflect the two primary mechanical actions on the flexspline: the forced deformation by the wave generator and the resisting torque from the load. For a common four-contact-point deformation pattern (e.g., from a four-roller wave generator), the deformation is simulated by applying inward radial pressure or prescribed displacements over four small rectangular patches on the inner surface of the cup wall, located at the azimuthal positions corresponding to the force application angles \( \beta \) and \( \beta + 180^\circ \), and their symmetric counterparts. The magnitude of this pressure is derived from the theoretical deformation force or calibrated against known deformation shapes. The output torque is simulated by applying a torsional moment, represented as a tangential shear stress distribution, over the outer surface of the equivalent toothed rim section or at the mounting flange. Finally, the appropriate degrees of freedom are constrained, typically by fixing all displacements at the mounting bolt holes on the output flange.
The finite element model is then meshed with high-quality elements. Areas of anticipated high-stress gradients, such as the fillet regions where the cup wall meets the diaphragm and the zones under the applied pressure patches, require a locally refined mesh. The rest of the structure can be meshed with a coarser yet adequate element size to balance accuracy and computational cost. Hexahedral (brick) elements are preferred for their accuracy in stress calculation, though a mixed mesh of hexahedral and tetrahedral elements may be used for complex geometries. The material properties, such as Young’s modulus \( E \), Poisson’s ratio \( \nu \), and most importantly, the fatigue properties (S-N curve or strain-life parameters) must be assigned accurately, often requiring data from material testing for the specific alloy used (commonly high-strength steels or advanced alloys). A static structural analysis is performed first to obtain the stress and strain tensors at every node in the model for the defined load case.
The core of the fatigue life prediction lies in post-processing the static stress results. ANSYS and similar FEA suites include dedicated fatigue analysis modules that operate on the principle of linear cumulative damage, typically using Miner’s Rule:
$$D = \sum_{i=1}^{k} \frac{n_i}{N_i}$$
where \( D \) is the total cumulative damage (failure is assumed at \( D = 1 \)), \( n_i \) is the number of cycles at a specific stress level, and \( N_i \) is the number of cycles to failure at that stress level as defined by the material’s S-N curve. For a constant amplitude loading simulation, the stress state from the static analysis is treated as the alternating stress amplitude \( \sigma_a \). Since the flexspline experiences a fully reversed stress cycle (from a tensed state to a compressed state during each wave generator revolution), the stress ratio \( R = -1 \). The mean stress \( \sigma_m \) is zero. However, the analysis must account for stress concentrations, multi-axial stress states, and mean stress effects that may arise from assembly preloads or constant torque components. This is often handled by calculating an equivalent alternating stress (e.g., using the von Mises criterion) and then applying a mean stress correction theory such as the Goodman, Gerber, or Soderberg rule. The Goodman rule is frequently applied:
$$\sigma_{eq} = \frac{\sigma_a}{1 – \frac{\sigma_m}{\sigma_{uts}}}$$
where \( \sigma_{eq} \) is the equivalent fully reversed stress amplitude, and \( \sigma_{uts} \) is the ultimate tensile strength of the material. The fatigue tool then consults the material’s S-N curve with this equivalent stress to determine the life \( N_f \) (in cycles) for each node. The resulting life distribution is plotted as a contour map on the model, clearly identifying the location with the shortest predicted life (the most vulnerable point) and its corresponding life in cycles or hours, given an operational speed.
| Parameter Category | Description | Typical Value / Method |
|---|---|---|
| Geometry | Flexspline Type | Cup-shaped, with diaphragm |
| Tooth Count | e.g., 200 teeth (simplified to equivalent rim) | |
| Key Feature Modeling | Accurate fillet radii at cup-diaphragm junction | |
| Material | Type | High-strength alloy steel (e.g., 30CrMnSiA, 40CrNiMoA) |
| Young’s Modulus (E) | ~210 GPa | |
| Poisson’s Ratio (ν) | ~0.3 | |
| Fatigue Data | S-N curve input (from material testing standards) | |
| Loads & BCs | Deformation Pattern | Four-roller wave generator (β ≈ 25°-30°) |
| Applied Torque | Rated output torque applied to rim/flange | |
| Constraints | Fixed support at mounting flange bolt holes | |
| FEA Settings | Element Type | Solid 186 (3D 20-node brick) |
| Fatigue Theory | Stress-life (S-N), Fully Reversed (R=-1) | |
| Mean Stress Correction | Goodman Rule | |
| Typical Results | Max Stress Location | Cup inner wall, near pressure application zones & fillet |
| Min Predicted Life | Order of 10^6 – 10^8 cycles (e.g., ~900 hours at 1000 rpm input) |
The results from such a simulation provide profound insights. The static stress analysis reveals the precise locations of maximum stress, which are consistently found to be on the inner surface of the flexspline cup, aligned with the areas just adjacent to the edges of the applied pressure patches from the wave generator rollers, and at the stress-concentrating fillet where the cylindrical wall transitions to the diaphragm. The fatigue life contour plot subsequently shows the minimum life coinciding with these high-stress regions. The predicted life, expressed in cycles, can be easily converted to operational hours based on the input speed of the wave generator. For example, a prediction of \( 5.4 \times 10^7 \) cycles with an input speed of 1000 RPM translates to:
$$\text{Life (hours)} = \frac{5.4 \times 10^7 \text{ cycles}}{1000 \text{ cycles/minute} \times 60 \text{ minutes/hour}} \approx 900 \text{ hours}$$
This quantitative output is invaluable. It allows for a direct comparison of different design variants—such as changes in wall thickness, fillet radius, or material—by observing the effect on the minimum predicted life. The method demonstrates that finite-element-based fatigue simulation is a powerful and effective tool for the life estimation of strain wave gear reducers, moving beyond the limitations of purely analytical formulas.
However, it is critical to acknowledge the limitations and assumptions inherent in this simulation approach to properly contextualize the results. The simplification of the toothed rim ignores local bending stresses in individual teeth and the complex, sliding contact conditions at the meshing interface, which can be sources of micropitting or wear-related failure. The analysis presented is a high-cycle fatigue assessment based on elastic stresses; it does not account for potential low-cycle fatigue or ratcheting if local plasticity occurs. Furthermore, the assumed loading is idealized and constant-amplitude. In real-world applications, the strain wave gear experiences variable amplitude loading, shock loads, and environmental factors like temperature fluctuations and contamination, which are not captured in this baseline simulation. The accuracy of the prediction is also heavily dependent on the quality of the input material fatigue data, which can exhibit significant scatter.
| Method | Principle | Advantages | Disadvantages |
|---|---|---|---|
| Empirical Formulas | Based on ring/shell theory with safety factors. | Fast calculation; useful for initial sizing. | Low accuracy; ignores local stress concentrations; relies on broad assumptions. |
| Experimental Strain Gauge | Physical measurement on prototype under load. | Provides real-world validation data at specific points. | Point data only; costly and time-consuming; requires a physical prototype. |
| Full 3D FEA with Contact | Explicit modeling of all teeth and nonlinear contact. | Highest potential accuracy; captures detailed tooth root stresses and load sharing. | Extremely high computational cost; complex setup; often impractical for initial design iterations. |
| Simplified FEA with Fatigue Module (This Work) | Equivalent rim model with applied loads, post-processed for fatigue. | Good balance of accuracy and efficiency; identifies critical life-limiting areas in the cup body; enables design optimization. | Simplifications may miss tooth-specific failures; dependent on accurate load estimation and material data. |
To enhance the fidelity of the simulation, the methodology can be extended in several directions. A multi-step coupled analysis could be performed: first, a detailed nonlinear contact analysis of a small sector of the gear mesh to accurately determine the forces transferred to the flexspline body. These force histories could then be mapped as time-varying boundary conditions onto the simplified global model for a transient structural analysis, the results of which feed into a more sophisticated fatigue analysis capable of handling spectrum loading. Furthermore, integrating crack initiation and propagation laws based on fracture mechanics could allow for a prediction of the crack growth phase, providing a more complete picture of the total useful life of the component. Sensitivity analyses can also be conducted to understand the impact of key parameters on life, as summarized below:
| Parameter | Typical Design Range | Effect on Minimum Predicted Fatigue Life | Remarks |
|---|---|---|---|
| Cup Wall Thickness | 1-3 mm (varies with size) | Life ∝ (Thickness)^m (m ~ 3-5 for bending stress) | Primary design variable; increasing thickness rapidly improves life but adds weight and reduces compliance. |
| Fillet Radius at Cup-Diaphragm | 0.5-3 mm | Life increases dramatically with radius up to an optimal point. | Critical for reducing stress concentration factor (Kt). |
| Applied Torque (Load) | Up to rated torque | Life ∝ (1/Torque)^b, where b is the Basquin exponent (slope of S-N curve). | For high-cycle fatigue, life is very sensitive to overloads (b is often between 6-10 for steel). |
| Wave Generator Deformation (ω₀) | Defined by tooth geometry | Life decreases sharply with increased radial deflection. | Fundamental to gear operation; optimized for proper mesh engagement without excess stress. |
| Material Ultimate Strength (σ_uts) | 800-1500 MPa | Higher strength generally increases life, especially when mean stress is present. | Choice balances fatigue strength, toughness, and manufacturability. |
In conclusion, the simulation of fatigue life for strain wave gear reducers, employing a rationally simplified finite element model coupled with established fatigue post-processing techniques, represents a significant advancement over purely analytical methods. My analysis confirms that the flexspline’s inner cup wall, particularly in regions adjacent to the wave generator’s force application points and at geometric discontinuities, is the life-limiting component. The method successfully provides a quantitative life estimate, such as a specific number of cycles or operational hours, which is essential for reliability-centered design, maintenance planning, and risk assessment. While the approach involves necessary simplifications—primarily the replacement of the detailed tooth geometry with an equivalent stiffness rim—it achieves an excellent compromise between computational practicality and engineering accuracy for assessing the dominant fatigue failure mode. This foundational model serves as a robust platform. Future work to enhance its predictive power would involve incorporating dynamic load spectra from multibody dynamics simulations, using more advanced material models that account for surface treatments (like shot peening), and validating the simulation results against a statistically significant set of physical fatigue tests. Through such iterative refinement, the virtual prototyping and life prediction of these sophisticated and critical strain wave gear mechanisms will continue to improve, driving forward the reliability of the advanced systems that depend on them.