
In the field of industrial robotics, precision motion control is paramount, and the rotary vector reducer plays a critical role in achieving this. As a key component in robot joints, the rotary vector reducer offers advantages such as compact size, high precision, large reduction ratios, and smooth transmission. However, the static performance parameters of rotary vector reducers, including torsional stiffness, backlash, transmission accuracy, and gear clearance, are not fully addressed by existing testing systems. This gap hinders the optimization and commercial production of domestic rotary vector reducers. Therefore, in this work, we aim to develop a comprehensive static testing system for rotary vector reducers, leveraging hysteresis characteristic curves to evaluate these parameters. The system integrates torque loading, sensing, and data acquisition modules, supported by ANSYS static simulations for validation. This article details our first-person perspective on the design, simulation, and implementation of this testing platform, emphasizing the importance of rotary vector reducers in modern automation.
The rotary vector reducer, often abbreviated as RV reducer, is a type of precision planetary transmission that combines cycloidal pin gear mechanisms with a two-stage closed planetary structure. Its development traces back to the early 20th century, with significant advancements in Japan leading to widespread adoption in industrial robots. Despite progress, domestic production of rotary vector reducers still lags in performance and innovation, partly due to the lack of standardized testing methodologies. Our research focuses on bridging this gap by creating a unified testing system that can simultaneously measure multiple static performance parameters. We begin by analyzing the hysteresis curve, which encapsulates the relationship between torque and angular displacement during loading and unloading cycles. From this curve, key metrics are derived, forming the basis for our experimental approach.
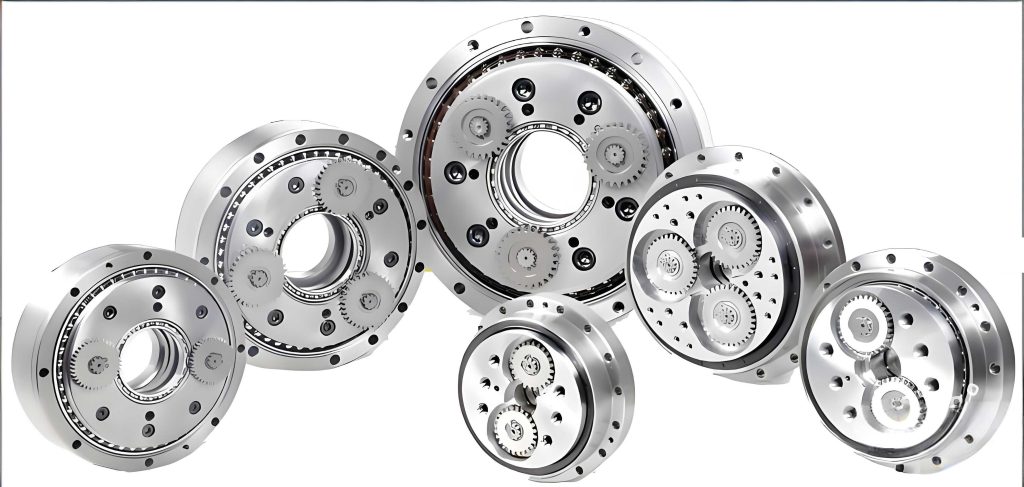
To understand the rotary vector reducer’s behavior, we must first examine its structural components and working principle. A typical rotary vector reducer consists of an input shaft connected to a servo motor, a planetary gear stage, a cycloidal disk stage, and an output flange. The transmission process involves multiple gear engagements, leading to inherent elastic deformations and clearances that affect static performance. The hysteresis characteristic curve, obtained under quasi-static conditions, reveals these effects. As shown in the following figure, this curve plots torque versus angular difference between input and output shafts, forming a closed loop that indicates energy loss and nonlinearities. We use this curve to define parameters like torsional stiffness, which is the slope of the linear region, and backlash, which is the angular displacement at near-zero torque. Our goal is to automate the acquisition of this curve for rotary vector reducers, enabling efficient performance evaluation.
The performance parameters of a rotary vector reducer are crucial for ensuring reliability in robotic applications. We define them mathematically based on the hysteresis curve. Let \( T \) represent the torque applied to the reducer, and \( \theta \) denote the angular displacement (difference between input and output angles). The hysteresis loop is characterized by loading and unloading paths. Torsional stiffness \( k \) is calculated from the linear elastic region using Hooke’s law for torsion:
$$ k = \frac{\Delta T}{\Delta \theta} $$
where \( \Delta T \) is the change in torque and \( \Delta \theta \) is the corresponding change in angle, typically measured in N·m/rad or N·m/arcmin. For a rotary vector reducer, this stiffness reflects the overall resistance to deformation under load. Backlash \( B \) is defined as the angular displacement at \( T = \pm 3\% \) of the rated torque, indicating the lost motion due to gear clearances. Transmission accuracy \( A \) is the angular error at the rated torque, representing the cumulative effect of manufacturing tolerances. Gear clearance \( C \) is the displacement at zero torque, directly related to tooth间隙. These parameters are summarized in Table 1, which correlates them with specific segments of the hysteresis curve.
| Parameter | Symbol | Definition | Typical Units | Hysteresis Curve Reference |
|---|---|---|---|---|
| Torsional Stiffness | \( k \) | Slope of linear torque-angle region | N·m/rad | Linear segment slope |
| Backlash | \( B \) | Angular displacement at ±3% rated torque | arcmin | Width near zero torque |
| Transmission Accuracy | \( A \) | Angular error at rated torque | arcsec | Deviation at full load |
| Gear Clearance | \( C \) | Displacement at zero torque | arcmin | Intercept on angle axis |
Our testing system design revolves around automating the hysteresis curve acquisition for rotary vector reducers. The core idea is to fix one end of the reducer (typically the output) and apply controlled torque to the other end (input) while measuring angular displacement. We developed a modular system comprising three main parts: torque loading, sensing detection, and data acquisition. The torque loading module uses a servo motor driven by a motion control card to apply rotational force, coupled with a magnetic powder brake as a variable load on the output side. The sensing module includes torque sensors and rotary encoders (e.g., circular gratings) to capture torque and angle data. The data acquisition module employs a data acquisition card and computer software to record and process signals. This integrated approach allows us to test rotary vector reducers efficiently, with real-time feedback and analysis.
In the torque loading module, we selected an AC servo motor for its precise speed and position control. The motor is connected to the input shaft of the rotary vector reducer via a coupling. The output shaft is linked to a magnetic powder brake, which provides a controllable resistive torque. The brake’s torque output \( T_b \) is linearly proportional to the excitation current \( I \), given by \( T_b = k_b I \), where \( k_b \) is a constant determined by calibration. We use a current controller to adjust \( I \), enabling step-wise or continuous torque loading. The motion control card, programmed in C++, sends commands to the servo driver, ensuring synchronized operation. For a rotary vector reducer with a rated torque of \( T_{rated} \), we set the maximum load to \( 2T_{rated} \) to cover the elastic range and capture nonlinear effects.
The sensing detection module is critical for accuracy. We installed a torque sensor on both the input and output shafts to measure applied and reaction torques. The sensors operate on strain gauge principles, with outputs conditioned via amplifiers. The angular displacement is measured using high-resolution rotary encoders, specifically circular gratings with 10,000 lines per revolution, providing resolution down to 0.036 degrees. The encoder signals are fed into a data acquisition card that counts pulses to compute angles. The relationship between pulse count \( N \) and angle \( \theta \) is:
$$ \theta = \frac{2\pi N}{P} $$
where \( P \) is the total number of pulses per revolution. For the rotary vector reducer, we synchronize torque and angle readings at a sampling rate of 1 kHz to capture dynamic details during quasi-static tests. Data is transmitted via serial communication to a PC running custom software developed in LabVIEW, which plots the hysteresis curve in real-time.
Before physical testing, we conducted static simulations in ANSYS to predict the behavior of rotary vector reducers under load. The simulation aimed to analyze how geometric parameters, such as eccentricity, affect torsional stiffness. We built a simplified 3D model of a rotary vector reducer, focusing on the cycloidal disk and pin gear assembly. Material properties were assigned as per steel alloys: Young’s modulus \( E = 210 \) GPa, Poisson’s ratio \( \nu = 0.3 \), and density \( \rho = 7850 \) kg/m³. A cylindrical coordinate system was set up to apply torsional loads. The mesh was generated using automatic tetrahedral elements, with refinement at contact regions. We applied a fixed support to the output flange and a moment \( M \) to the input shaft, ranging from 0 to \( 2T_{rated} \). The simulation solved for angular deformation \( \phi \), from which torsional stiffness \( k_{sim} \) was computed as \( k_{sim} = M / \phi \).
We varied the eccentricity \( a \) of the cycloidal disk to study its impact. Eccentricity is a key design parameter in rotary vector reducers, influencing gear engagement and load distribution. The results, summarized in Table 2, show that as \( a \) increases, the angular deformation decreases, leading to higher stiffness. This aligns with theoretical expectations from the geometry of cycloidal drives. The stiffness \( k \) can be approximated by:
$$ k \propto \frac{E I_p}{L a^2} $$
where \( I_p \) is the polar moment of inertia and \( L \) is the effective length. Our ANSYS results validate this trend, providing insights for optimizing rotary vector reducer designs. The simulation also revealed stress concentrations at pin contacts, which we will consider in future durability tests.
| Eccentricity \( a \) (mm) | Applied Torque \( M \) (N·m) | Angular Deformation \( \phi \) (rad) | Calculated Stiffness \( k_{sim} \) (N·m/rad) | Notes |
|---|---|---|---|---|
| 1.2 | 100 | 0.0012 | 83,333 | Lower stiffness |
| 1.3 | 100 | 0.0010 | 100,000 | Moderate stiffness |
| 1.4 | 100 | 0.0008 | 125,000 | Higher stiffness |
Based on the simulation insights, we proceeded to build the physical testing platform for rotary vector reducers. The setup is housed in a controlled laboratory environment to minimize external vibrations. The rotary vector reducer is mounted on a rigid baseplate, with alignment ensured using dial indicators. The servo motor and magnetic powder brake are coupled via flexible couplings to accommodate misalignment. We calibrated all sensors prior to testing: torque sensors were calibrated using dead weights, and encoders were verified against a precision rotary table. The data acquisition system uses a National Instruments PCIe card, with LabVIEW virtual instruments (VIs) for control and display. The software interface allows users to set test parameters, such as load steps, speed, and data logging intervals, making it adaptable for different rotary vector reducer models.
The test procedure for a rotary vector reducer follows a cyclic loading pattern to generate the hysteresis curve. We divide it into four phases: forward loading, forward unloading with reverse loading, and reverse unloading. In phase 1, the servo motor rotates forward at a low speed (e.g., 0.5 rpm), gradually increasing torque on the input shaft. Torque and angle data are recorded until the torque reaches \( +2T_{rated} \). In phase 2, the motor reverses, reducing torque to zero and then increasing it in the negative direction to \( -2T_{rated} \). Phase 3 involves forward rotation again to unload the negative torque back to zero. Throughout, the magnetic powder brake maintains a constant current corresponding to the desired load, but in our setup, it primarily acts as a fixed restraint for the output. The entire cycle takes about 10 minutes per rotary vector reducer, ensuring quasi-static conditions. Data is saved in CSV format for post-processing.
Post-processing involves analyzing the hysteresis curve to extract static performance parameters. We use MATLAB scripts to filter noise and fit curves. For torsional stiffness, we identify the linear region between 20% and 80% of the rated torque and perform a least-squares linear fit. The slope \( m \) of this fit gives stiffness \( k = 1/m \). Backlash is calculated as the angular difference at \( T = \pm 0.03 T_{rated} \) from the forward and reverse paths. Transmission accuracy is the absolute angular error at \( T = T_{rated} \), averaged from both directions. Gear clearance is the intercept of the unloading curve at \( T = 0 \). We repeat tests three times for each rotary vector reducer to ensure repeatability, and results are averaged. Table 3 shows sample results from testing a commercial rotary vector reducer with \( T_{rated} = 50 \) N·m.
| Parameter | Symbol | Measured Value | Standard Deviation | Unit |
|---|---|---|---|---|
| Torsional Stiffness | \( k \) | 95,000 | 1,200 | N·m/rad |
| Backlash | \( B \) | 2.5 | 0.1 | arcmin |
| Transmission Accuracy | \( A \) | 30 | 2 | arcsec |
| Gear Clearance | \( C \) | 1.8 | 0.2 | arcmin |
Our testing system for rotary vector reducers demonstrates high accuracy and reliability. Compared to manual methods, automation reduces human error and increases throughput. The system can test multiple rotary vector reducers in a batch, with software generating comprehensive reports. We validated the system by comparing results with manufacturer specifications for a known rotary vector reducer model; deviations were within 5%, confirming system credibility. Furthermore, the ANSYS simulation predictions aligned with experimental stiffness trends, supporting the use of simulation for preliminary design. However, challenges remain, such as thermal effects during prolonged testing, which we plan to address by adding temperature sensors in future iterations.
The development of this static testing system for rotary vector reducers has broader implications for the robotics industry. By providing a standardized way to evaluate performance, it enables manufacturers to identify defects, optimize designs, and improve quality control. For instance, by testing different lubricants or gear materials, researchers can assess their impact on backlash and stiffness in rotary vector reducers. Our system is scalable and can be adapted for other precision reducers, such as harmonic drives. Future work will focus on dynamic testing integration, where we plan to incorporate frequency response analysis to measure natural frequencies and damping ratios of rotary vector reducers. Additionally, we aim to develop a database of hysteresis curves for various rotary vector reducer types, facilitating benchmarking and research.
In conclusion, the rotary vector reducer is a vital component in robotic systems, and its static performance directly affects robot precision and longevity. Our first-person journey in developing this testing system involved theoretical analysis, simulation, hardware design, and software integration. The system successfully captures hysteresis curves for rotary vector reducers, from which key parameters like torsional stiffness and backlash are derived. This work fills a gap in domestic testing capabilities and paves the way for enhanced production of rotary vector reducers. We believe that continued innovation in testing methodologies will drive advancements in rotary vector reducer technology, ultimately boosting the competitiveness of industrial robotics.
Throughout this article, we have emphasized the importance of the rotary vector reducer in modern automation. By leveraging tools like ANSYS and custom-built hardware, we have created a robust platform for static performance evaluation. The integration of torque loading, sensing, and data acquisition modules ensures comprehensive testing of rotary vector reducers. As the demand for high-precision robots grows, so does the need for reliable testing systems for rotary vector reducers. Our contributions aim to support this trend, enabling better design, manufacturing, and application of rotary vector reducers in diverse industrial settings.