
As a researcher focused on precision mechanical transmissions, I have long been intrigued by the performance of rotary vector reducers, especially their transmission accuracy under operational loads. The rotary vector reducer is a critical component in robotics and high-precision machinery, where its transmission error directly impacts positioning accuracy and system stability. While existing studies and industrial tests often evaluate transmission error under no-load conditions, this approach fails to capture the true behavior of the rotary vector reducer in real-world applications where torque loads are present. This gap motivated me to design and conduct a comprehensive experimental study to analyze how transmission error in a rotary vector reducer evolves under varying torque loads. In this article, I will detail the construction of a specialized test bench, the methodology employed, and the insightful results obtained, all while emphasizing the central role of the rotary vector reducer in modern engineering systems.
The transmission error of a gear system, including the rotary vector reducer, is fundamentally defined as the deviation between the actual output position and the theoretically ideal output position for a given input. Mathematically, for a rotary vector reducer with a nominal reduction ratio \( N \), the transmission error \( TE(t) \) can be expressed as:
$$ TE(t) = \theta_{out}(t) – \frac{\theta_{in}(t)}{N} $$
where \( \theta_{in}(t) \) is the instantaneous input angle and \( \theta_{out}(t) \) is the instantaneous output angle. This error arises from a combination of geometric imperfections (manufacturing and assembly errors), elastic deformations of components under load, and dynamic effects. For the rotary vector reducer, which typically comprises a cycloidal gear stage and a planetary gear stage, the transmission error is a complex superposition of errors from each stage and their interactions.
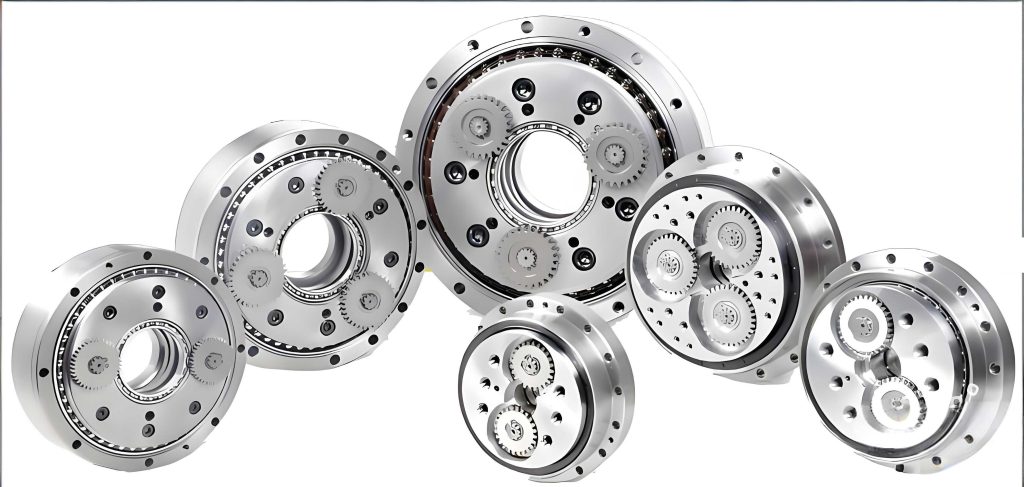
To investigate this, I designed and assembled a test rig capable of applying precise torque loads to the rotary vector reducer while measuring high-fidelity angular data. The layout of this test bench is systematic. On the input side, a servo drive motor provides controlled rotational motion. This motor is connected via a torque sensor and a high-rigidity coupling to the input shaft of the unit under test—a commercially available rotary vector reducer model with a reduction ratio comparable to the RV-20E type. The output shaft of the rotary vector reducer is then connected to a torque loading system, which in this case is a high-performance torque motor capable of applying bidirectional static and dynamic loads. The heart of the measurement system consists of two ultra-high-precision angular encoders, one mounted on the input side and one on the output side, with resolutions sufficient to capture arc-second level variations. All components are aligned on a massive, vibration-damped granite base to minimize external influences. The key parameters of this test bench, which I meticulously calibrated, are summarized in the table below.
| Parameter Name | Specification |
|---|---|
| Input Motor Power | 8.8 kW |
| Input Speed Range | ±4630 rpm |
| Input Torque Sensor Range | ±50 N·m |
| Input Encoder Resolution | ±2.5 arc-seconds |
| Loading Motor Power | 9.58 kW |
| Loading Motor Speed Range | ±3310 rpm |
| Output Torque Sensor Range | ±1000 N·m |
| Output Torque Measurement Accuracy | ±0.05% FS |
| Output Encoder Resolution | ±2 arc-seconds |
| Data Acquisition Sampling Frequency | 2000 Hz |
The testing philosophy was to isolate the effect of load torque on the transmission error of the rotary vector reducer. Therefore, I maintained a constant input speed while systematically varying the output load torque. The input speed was set to 140 rpm, a value representative of typical operational conditions. The load torque was applied in discrete steps: 0 N·m (no-load), 83.5 N·m (0.5 times the rated torque \(T_0\)), 167 N·m (1.0 \(T_0\)), and 334 N·m (2.0 \(T_0\)). For each torque condition, data was recorded for one complete revolution of the output shaft (360 degrees) to capture the full error cycle. Furthermore, to account for any directional effects inherent to the rotary vector reducer, tests were conducted in both clockwise (positive) and counterclockwise (negative) rotation directions. Prior to data collection at each stage, the rotary vector reducer was run for 30 minutes to reach thermal equilibrium and stabilize its performance. The complete test matrix is outlined in the following table.
| Step | Input Speed (rpm) | Load Torque (N·m) | Load Factor (vs. \(T_0\)) | Measurement Arc |
|---|---|---|---|---|
| 1 | 140 | 0 | 0 | 360° |
| 2 | -140 | 0 | 0 | 360° |
| 3 | 140 | 83.5 | 0.5 | 360° |
| 4 | -140 | 83.5 | 0.5 | 360° |
| 5 | 140 | 167.0 | 1.0 | 360° |
| 6 | -140 | 167.0 | 1.0 | 360° |
| 7 | 140 | 334.0 | 2.0 | 360° |
| 8 | -140 | 334.0 | 2.0 | 360° |
The raw data from the encoders was processed offline. The transmission error \( TE \) was calculated for each sample point using the formula above. The peak-to-peak value of \( TE \) over one output revolution was extracted as the primary amplitude metric. Furthermore, to delve into the harmonic structure of the error, I performed a spectral analysis on the \( TE \) time-series data. A Discrete Fourier Transform (DFT) was applied. The one-sided amplitude spectrum was computed, and the frequency axis was normalized by the output shaft rotational frequency \( f_0 \). This yields non-dimensional frequency ratios \( f/f_0 \), where an integer value indicates a harmonic corresponding to an error repeating that many times per output revolution. This is crucial for diagnosing error sources within the rotary vector reducer, as different mechanical components (e.g., number of cycloidal gear teeth, number of planetary pins) excite specific harmonics.
The results were striking and revealed clear trends. The most fundamental observation was the significant increase in transmission error amplitude with increasing load torque for the rotary vector reducer. The quantitative data is consolidated in the table below.
| Load Condition (Multiplier of \(T_0\)) | Peak-to-Peak TE, Clockwise (arc-seconds) | Peak-to-Peak TE, Counterclockwise (arc-seconds) |
|---|---|---|
| 0 (No-load) | 72.52 | 71.02 |
| 0.5 | 89.34 | 88.05 |
| 1.0 (Rated) | 106.86 | 104.15 |
| 2.0 | 149.36 | 142.71 |
From the no-load state to the rated load condition, the transmission error of the rotary vector reducer increased by approximately 47% for both directions. When the load was doubled to twice the rated torque, the error increased by an additional 37-40% relative to the rated load error. This non-linear growth suggests that the underlying mechanisms contributing to error change with load. At very low loads, the transmission error in a rotary vector reducer is predominantly governed by the superposition of fixed geometric errors from manufacturing and assembly. As load increases, elastic deformations become significant. Components like the cycloidal disk, pins, bearings, and housing experience strain, which alters the ideal meshing geometry and contact conditions within the rotary vector reducer. This load-induced deflection effectively introduces additional kinematic error, which adds to the static geometric error. The consistency between clockwise and counterclockwise results indicates that the behavior of this particular rotary vector reducer is largely symmetric with respect to direction, though minor asymmetries exist, possibly due to assembly preload or run-in wear.
The spectral analysis provided even deeper insights into the internal behavior of the rotary vector reducer under load. The amplitude of specific frequency ratio components showed distinct sensitivity to torque. The table below summarizes the amplitudes (in arc-seconds) of the most prominent harmonics for all load conditions.
| Rotation | Frequency Ratio \(f/f_0\) | No-load Amplitude | 0.5\(T_0\) Amplitude | 1.0\(T_0\) Amplitude | 2.0\(T_0\) Amplitude |
|---|---|---|---|---|---|
| Clockwise | 40 | 9.34 | 8.47 | 7.56 | 7.03 |
| 80 | 6.48 | 17.12 | 26.61 | 41.22 | |
| 120 | 0.95 | 1.33 | 1.19 | 1.07 | |
| 160 | 3.13 | 7.30 | 9.42 | 11.81 | |
| 200 | 5.45 | 4.52 | 4.24 | 4.30 | |
| Counterclockwise | 40 | 9.66 | 10.88 | 11.01 | 8.04 |
| 80 | 4.87 | 12.36 | 21.55 | 35.92 | |
| 120 | 0.95 | 1.25 | 1.41 | 0.88 | |
| 160 | 3.01 | 6.40 | 8.73 | 11.19 | |
| 200 | 5.28 | 4.53 | 4.33 | 4.29 |
The harmonics at frequency ratios 80 and 160 exhibited dramatic growth with increasing load. For the clockwise rotation, the amplitude at \(f/f_0 = 80\) surged from 6.48 arc-seconds under no-load to 41.22 arc-seconds under 2\(T_0\)—a more than sixfold increase. Similarly, the harmonic at \(f/f_0 = 160\) increased nearly fourfold. In contrast, the amplitude of the harmonic at \(f/f_0 = 40\) remained relatively stable or even slightly decreased, and the harmonic at \(f/f_0 = 200\) showed minimal change. This selective amplification is highly informative. In a typical rotary vector reducer, the cycloidal gear stage often has a tooth count (or more precisely, the number of lobes on the cycloidal disk) that is a multiple of the number of pins. For common designs, the primary error excitation from this stage appears at harmonics related to the number of pins or teeth. The observed sensitivity of the 80th and 160th harmonics strongly suggests that these components are directly linked to the elastic deformation of the cycloidal disk and the pin-wheel contact under load. The deformation alters the effective tooth profile periodically, creating error content at these specific harmonics. This can be modeled conceptually by considering the loaded tooth compliance. If we model the cycloidal disk as a deformable ring, the radial deflection \(\delta_r\) under a tangential load \(F_t\) at a given pin can be approximated by a stiffness relationship. The resulting profile modification \(\Delta p(\phi)\) as a function of angular position \(\phi\) could introduce harmonics related to the pin number \(Z_p\). A simplified expression might look like:
$$ \Delta p(\phi) \approx \sum_{k=1}^{n} C_k \cdot \cos(k Z_p \phi + \psi_k) $$
where \(C_k\) are coefficients dependent on load and stiffness, and \(k\) is the harmonic order. For \(Z_p = 40\), the first harmonic (\(k=1\)) would correspond to \(f/f_0 = 40\), and the second harmonic (\(k=2\)) to \(f/f_0 = 80\). The fact that the 80th harmonic grew much more than the 40th indicates that the load-induced deformation pattern in this rotary vector reducer is richer in the second harmonic. This could be due to the specific load distribution and boundary conditions of the cycloidal disk within the housing.
The stability of other harmonics implies they are primarily tied to fixed geometric errors. For instance, errors in the planetary gear stage or eccentricities might manifest at other frequency ratios but are not significantly magnified by load. This decoupling of error sources is a valuable diagnostic outcome for designers and quality engineers working on the rotary vector reducer. It underscores the necessity of evaluating the rotary vector reducer not just statically, but under the full spectrum of expected operational loads to ensure its precision in application.
To further generalize the relationship between transmission error amplitude and load for a rotary vector reducer, one could attempt to fit an empirical model. Based on the data, the peak-to-peak error \(E_{pp}\) seems to follow a power-law relationship with applied output torque \(T_{load}\):
$$ E_{pp}(T_{load}) = E_0 + \alpha \cdot (T_{load})^\beta $$
where \(E_0\) is the no-load error (dominated by geometry), and \(\alpha\) and \(\beta\) are constants. A simple curve fit to the clockwise data yields \(\beta \approx 0.65\), indicating a sub-linear but strong dependence. This model, while empirical, could be useful for predicting the performance degradation of a rotary vector reducer when used beyond its rated point or for different models after minimal characterization.
In conclusion, this experimental investigation has unequivocally demonstrated that the transmission error of a rotary vector reducer is highly dependent on the applied torque load. Relying solely on no-load tests for quality assessment or performance specification of a rotary vector reducer provides an incomplete and overly optimistic picture. The significant increase in error amplitude, coupled with the load-sensitive nature of specific harmonic components, reveals that elastic deformations become a dominant error source under operational conditions. Therefore, for high-precision applications demanding consistent accuracy from a rotary vector reducer, it is imperative to characterize its transmission error across the entire intended load range. Future work could involve testing multiple units to establish statistical distributions, investigating the effects of different lubrication conditions and temperatures, and developing more sophisticated multi-body dynamics models that incorporate contact elasticity to predict this behavior. Ultimately, a deep understanding of these load-dependent error mechanisms in the rotary vector reducer will drive advancements in design, manufacturing, and testing, leading to more accurate and reliable robotic and automated systems.