
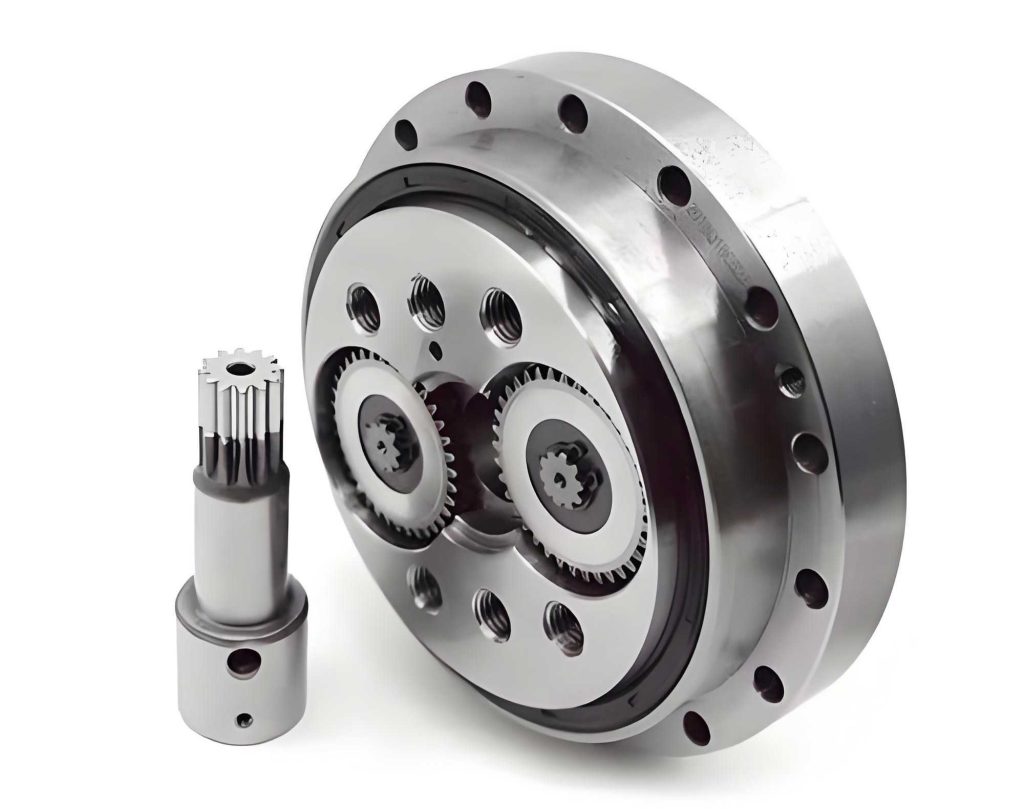
In the field of precision robotics and industrial automation, the RV reducer plays a critical role due to its high torque capacity, compact design, and superior accuracy. The angular transmission error (ATE) of the RV reducer is a key performance indicator that directly influences the positioning precision and operational stability of robotic systems. This error stems from various factors, including dimensional tolerances of components, bearing clearances, and modifications to cycloidal gear profiles. Traditional design and analysis methods often fall short in comprehensively evaluating these interdependent factors, leading to suboptimal performance. Therefore, this study aims to develop a robust framework for parametric modeling and multi-body dynamics simulation of the RV reducer, enabling a detailed investigation into the effects of error combinations on ATE. By leveraging advanced CAD parameterization and dynamic simulation techniques, we can create virtual prototypes that accurately replicate real-world behaviors, facilitating optimization of the RV reducer’s design for enhanced precision and reliability.
The foundation of this research lies in the parametric CAD modeling of the RV reducer components. Parameterization allows for rapid modification of design variables, such as gear geometry and dimensional errors, which is essential for exploring different error scenarios. The RV reducer primarily consists of a two-stage transmission system: the first stage involves involute gear pairs (sun gear and planetary gears), and the second stage comprises cycloidal gear pairs (cycloid gears and pin teeth). Key parameters for the RV80E-121 reducer model are summarized in Table 1.
| Parameter | Value | Parameter | Value |
|---|---|---|---|
| Module of involute gears, \(m\) (mm) | 1.75 | Number of cycloid gear teeth, \(z_c\) | 39 |
| Number of sun gear teeth, \(z_1\) | 12 | Number of pin teeth, \(z_p\) | 40 |
| Number of planetary gear teeth, \(z_2\) | 36 | Pin tooth center circle diameter, \(d_p\) (mm) | 153 |
| Eccentricity of cycloidal drive, \(a\) (mm) | 1.5 | Pin tooth diameter, \(d_{rp}\) (mm) | 6 |
For the involute gears, parametric modeling begins with extracting basic design parameters and applying an algorithm to generate the tooth profile. The involute curve is derived from the base circle, and a single tooth flank is created in a Cartesian coordinate system. This flank is then rotated around the Z-axis by half of the base circle tooth thickness angle and mirrored across the Y-axis to form a complete tooth profile. The parametric involute tooth profile ensures accuracy and consistency, as shown in the generated geometry. Similarly, for the cycloid gears, a full-tooth modeling approach is adopted to maintain continuity in the tooth surface, which is crucial for defining contact pairs in subsequent simulations. The cycloid profile is generated based on the trochoidal equation, considering the eccentricity and tooth count. The parametric cycloid tooth profile encompasses all \(z_c\) teeth in one operation, facilitating seamless integration into the assembly. The complete CAD assembly of the RV reducer, including the housing, gears, bearings, and output flange, is constructed using these parametric models, allowing for easy adjustments to dimensions and tolerances.
The multi-body dynamics simulation model is built upon the parametric CAD assembly, incorporating constraints, loads, and contact definitions to replicate the operational behavior of the RV reducer. The simulation environment employs a relative coordinate shape-space method combined with a bounding-box algorithm for efficient contact detection, which handles the nonlinearities inherent in gear meshing and clearance interactions. The RV reducer is configured with the pin housing fixed, the sun gear as the input, and the output flange as the load-bearing element. Constraints are applied accordingly: a fixed joint for the pin housing, planar joints for pin teeth to restrict axial movement, and a revolute joint for the sun gear. The input angular velocity and output load torque are defined as functions of time to simulate rated operating conditions, as specified in Table 2.
| Parameter | Function Expression |
|---|---|
| Sun gear input speed, \(n\) (°/s) | \(10,890 \times \text{step}(\text{time}, 0, 0, 0.2, 1)\) |
| Output flange load torque, \(T\) (N·mm) | \(-784,000 \times \text{step}(\text{time}, 0.2, 0, 0.4, 1)\) |
To enhance simulation efficiency without compromising accuracy, certain structural simplifications are made. For instance, involute spline connections are omitted by rigidly coupling planetary gears to crankshafts, bolt connections are replaced with fixed joints, and minor features like fillets and chamfers are removed. These simplifications reduce computational complexity while preserving the essential dynamics of the RV reducer.
Contact modeling is a critical aspect of the dynamics simulation, as it governs the interaction between mating components. For the involute gear pairs (sun gear and planetary gears) and the cycloidal gear pairs (cycloid gears and pin teeth), as well as the contacts between pin teeth and their slots, the normal contact force is calculated using the Lankarni formulation based on Hertzian contact theory. The contact force \(f_n\) is given by:
$$f_n = k \delta^{m_1} + c \frac{\dot{\delta}}{|\dot{\delta}|} \delta^{m_2} \delta^{m_3}$$
where \(k\) is the contact stiffness coefficient, \(c\) is the damping coefficient, \(\delta\) is the penetration depth, \(\dot{\delta}\) is the relative velocity, and \(m_1\), \(m_2\), \(m_3\) are empirical exponents for stiffness, damping, and indentation, respectively. The contact surfaces are discretized into triangular facets for precise force computation. For example, in the cycloid-pin contact, the pin tooth surface and cycloid gear surface are meshed, and a bounding box structure is used to expedite contact detection, ensuring realistic simulation of meshing forces under load.
Bearing clearances are another vital factor affecting the RV reducer’s performance. In the RV80E-121 model, rolling bearings include support bearings for the output flange, support flange, cycloid gear bearings, and crankshaft bearings. Instead of modeling detailed bearing geometries, bushing forces are employed to simulate bearing effects. The bushing model, specifically the BBTA (Bushing Between Two Axes) approach, represents the bearing as a series of circumferential segments with flexible spring connections between center nodes and peripheral nodes. This method introduces bearing clearance while avoiding redundant constraints and maintaining system degrees of freedom. The bushing force model for crankshaft bearings, for instance, distributes Mark nodes along the bearing width to capture radial and axial compliance, thereby accurately reflecting the influence of bearing play on the RV reducer’s dynamics.
The dynamics model is validated by comparing simulated angular velocities with theoretical values. Under the rated input speed, the angular velocities of key components and the overall reduction ratio are computed. The theoretical reduction ratio \(R\) for the RV reducer is given by:
$$R = 1 + \frac{z_p}{z_c} \times \frac{z_2}{z_1}$$
For the RV80E-121, with \(z_1 = 12\), \(z_2 = 36\), \(z_c = 39\), and \(z_p = 40\), the theoretical ratio is:
$$R = 1 + \frac{40}{39} \times \frac{36}{12} = 1 + \frac{40}{39} \times 3 = 1 + \frac{120}{39} \approx 4.0769$$
Considering the two-stage transmission, the overall ratio is approximately 121:1. Simulation results align closely with theory, as shown in Table 3, confirming the model’s accuracy for subsequent analyses of the RV reducer.
| Component | Theoretical Angular Velocity (°/s) | Simulated Angular Velocity (°/s) | Relative Error (%) |
|---|---|---|---|
| Sun Gear | 10,890 | 10,890 | 0 |
| Planetary Gear | -3,510 | -3,479.4 | 0.8 |
| Output Flange | 90 | 89.85 | 0.2 |
| Reduction Ratio | 121 | 121.9 | 0.8 |
With the validated model, we investigate the meshing characteristics of the cycloid-pin transmission under rated conditions. For a specific error combination (pin tooth center circle diameter \(d_p = 153.056\) mm and pin tooth slot diameter \(d_{sp} = 6.004\) mm), the normal contact forces between the cycloid gear and the first five pin teeth are simulated. The contact force curves exhibit periodic fluctuations, reflecting the engagement patterns in the RV reducer. The forces peak during full tooth contact and diminish during transitions, highlighting the dynamic load distribution in the cycloidal stage. This analysis provides insights into the stress variations and potential wear in the RV reducer, which are crucial for durability assessments.
The primary focus of this study is to analyze the impact of dimensional errors on the ATE of the RV reducer. The ATE \(\theta_{er}\) is defined as the difference between the theoretical output rotation angle and the actual output rotation angle:
$$\theta_{er} = \frac{\theta_{in}}{R} – \theta_{out}$$
where \(\theta_{in}\) is the input rotation angle, \(R\) is the reduction ratio, and \(\theta_{out}\) is the measured output rotation angle. Small-period factors, such as variations in the pin tooth center circle diameter and pin tooth slot diameter, are considered due to their influence on the meshing geometry. These parameters belong to the same assembly dimension chain, and their errors can combine to affect the RV reducer’s precision. To explore this, we establish a parametric simulation matrix by varying \(d_p\) and \(d_{sp}\) within their tolerance ranges. The design specifications are: \(d_p = 153.1_{-0.061}^{-0.038}\) mm and \(d_{sp} = 6_{+0.004}^{+0.012}\) mm. We increment \(d_p\) from the lower limit of 153.039 mm by +6 μm steps and \(d_{sp}\) from the lower limit of 6.004 mm by +2 μm steps, resulting in 25 error combination models, denoted as M_1 to M_25, as outlined in Table 4.
| \(d_p\) (mm) / \(d_{sp}\) (mm) | 6.004 | 6.006 | 6.008 | 6.010 | 6.012 |
|---|---|---|---|---|---|
| 153.039 | M_1 | M_2 | M_3 | M_4 | M_5 |
| 153.045 | M_6 | M_7 | M_8 | M_9 | M_10 |
| 153.051 | M_11 | M_12 | M_13 | M_14 | M_15 |
| 153.056 | M_16 | M_17 | M_18 | M_19 | M_20 |
| 153.062 | M_21 | M_22 | M_23 | M_24 | M_25 |
Each model is simulated under rated conditions, and the ATE is computed over a time interval. The peak-to-peak ATE values for all combinations are presented in Table 5, while the mean ATE values are summarized in Table 6. These results reveal the sensitivity of the RV reducer’s precision to dimensional variations.
| \(d_p\) (mm) / \(d_{sp}\) (mm) | 6.004 | 6.006 | 6.008 | 6.010 | 6.012 |
|---|---|---|---|---|---|
| 153.039 | 0.319 | 0.303 | 0.313 | 0.296 | 0.318 |
| 153.045 | 0.313 | 0.299 | 0.280 | 0.297 | 0.338 |
| 153.051 | 0.282 | 0.275 | 0.292 | 0.294 | 0.282 |
| 153.056 | 0.280 | 0.307 | 0.276 | 0.316 | 0.291 |
| 153.062 | 0.302 | 0.297 | 0.284 | 0.292 | 0.393 |
| \(d_p\) (mm) / \(d_{sp}\) (mm) | 6.004 | 6.006 | 6.008 | 6.010 | 6.012 |
|---|---|---|---|---|---|
| 153.039 | 3.051 | 3.116 | 3.180 | 3.242 | 3.308 |
| 153.045 | 3.185 | 3.249 | 3.314 | 3.377 | 3.440 |
| 153.051 | 3.315 | 3.382 | 3.444 | 3.507 | 3.571 |
| 153.056 | 3.426 | 3.490 | 3.552 | 3.630 | 3.679 |
| 153.062 | 3.555 | 3.619 | 3.681 | 3.745 | 3.832 |
For instance, in model M_25 (with \(d_p = 153.062\) mm and \(d_{sp} = 6.012\) mm), the ATE curve is shifted to zero mean for clarity, showing a maximum error of +0.1793 arcminutes and a minimum of -0.1235 arcminutes over a 1 to 1.5-second interval. The ATE curves for different combinations, such as M_4, M_10, and M_23, demonstrate not only variations in amplitude but also shifts in initial phase, indicating that error combinations alter the timing of meshing events in the RV reducer. This phase shift can affect the synchronization of the transmission system, potentially leading to cumulative errors in repetitive operations.
To further analyze the trends, we plot the ATE as a function of \(d_{sp}\) for fixed \(d_p\) values and vice versa. When \(d_p\) is held constant, the ATE versus \(d_{sp}\) curve exhibits inflection points, suggesting that there exists an optimal \(d_{sp}\) value that minimizes error for a given \(d_p\). Similarly, with constant \(d_{sp}\), the ATE versus \(d_p\) curve also shows inflection points, highlighting the nonlinear relationship between dimensional errors and the RV reducer’s performance. These inflection points correspond to configurations where the meshing geometry balances clearance and interference, reducing backlash and improving accuracy. The combined effect of \(d_p\) and \(d_{sp}\) errors on ATE is visualized through surface plots, emphasizing that error coupling can either amplify or mitigate individual error impacts in the RV reducer.
The underlying mechanism for these observations relates to the periodic nature of ATE in the RV reducer. The cycloidal transmission generates small-period fluctuations due to tooth engagement cycles, and dimensional errors modulate these fluctuations by altering the effective clearance between components. The pin tooth center circle diameter affects the positioning of pin teeth relative to the cycloid gear, while the pin tooth slot diameter influences the fit between pin teeth and their housing. Their combination determines the overall backlash in the second stage, which directly impacts ATE. Mathematical modeling of this relationship can be expressed as a function of errors \(\Delta d_p\) and \(\Delta d_{sp}\):
$$\theta_{er} = f(\Delta d_p, \Delta d_{sp}) = A \sin(\omega t + \phi) + B \Delta d_p + C \Delta d_{sp} + D \Delta d_p \Delta d_{sp}$$
where \(A\), \(B\), \(C\), and \(D\) are coefficients derived from simulation data, \(\omega\) is the engagement frequency, and \(\phi\) is the phase shift. The cross-term \(D \Delta d_p \Delta d_{sp}\) captures the coupling effect, which is significant in the RV reducer as evidenced by the non-additive behavior in Tables 5 and 6.
In addition to dimensional errors, other factors like bearing clearance and cycloid gear modifications also contribute to ATE. For bearing clearance, we simulate different clearance grades using the bushing model and observe that increased clearance generally elevates ATE by introducing more play in the system. However, the effect is less pronounced than dimensional errors in the cycloidal stage, reinforcing the importance of precise manufacturing for pin-related components in the RV reducer. Regarding cycloid gear modifications, such as tooth profile grinding or chamfering, parametric models allow us to incorporate these adjustments and assess their impact on meshing smoothness and error reduction. Typically, moderate modifications can compensate for assembly tolerances, enhancing the RV reducer’s performance.
The simulation framework developed here offers a practical tool for optimizing the RV reducer design. By running parametric sweeps over error ranges, designers can identify tolerance combinations that meet precision requirements while minimizing manufacturing costs. For example, based on our results, selecting \(d_p\) near 153.051 mm and \(d_{sp}\) near 6.008 mm yields relatively low ATE for the RV80E-121 model. This approach aligns with robust design principles, ensuring that the RV reducer performs consistently across production variations.
In conclusion, this study establishes a comprehensive methodology for parametric modeling and multi-body dynamics simulation of the RV reducer. The integration of CAD parameterization with advanced contact algorithms enables accurate virtual prototyping, facilitating in-depth analysis of error influences on angular transmission error. Key findings indicate that dimensional errors in the pin tooth center circle diameter and pin tooth slot diameter significantly affect the RV reducer’s precision, with their combination leading to nonlinear changes in error amplitude and phase. The presence of inflection points in error-response curves suggests optimal error matching for enhanced accuracy. These insights contribute to a better understanding of error coupling mechanisms in the RV reducer, guiding tolerance design and assembly processes. Future work could extend this framework to include thermal effects, lubrication dynamics, and long-term wear simulations, further improving the predictive capabilities for the RV reducer in high-performance applications.