
I have watched the maintenance of rail vehicle wheel-axle assemblies change from a craft that depended almost entirely on human hands into a process governed by data, closed-loop control, and industrial robots. The change did not arrive as a single dramatic event. It arrived through hundreds of small observations: a micrometer reading captured automatically, a press-fit curve displayed in real time, a vision system rejecting a component before it could move forward, and a six-axis arm repeating a delicate trajectory with a consistency that no human wrist could match. What I see now in the wheel-axle repair area is a new kind of industrial discipline, one in which industrial robots do not replace human judgment but extend it into dimensions of precision, speed, and traceability that were previously impossible to sustain at scale.
From my first-person perspective, the most important development is not simply that a machine can lift or position a heavy wheel set. The important development is that the entire wheel-axle repair chain has become an autonomous closed loop. Axle diameter measurement, intelligent matching, precision press-fitting, and running-in testing are no longer isolated workstations connected by manual handoffs. They are linked by data, control logic, and industrial robots that can execute the full sequence with minimal intervention. I can follow a wheel set from the first measurement to the final test and see a continuous digital thread rather than a collection of disconnected operations.
When I speak with colleagues who remember the earlier process, they describe a different reality. Heavy components were moved by hand or with general-purpose lifting equipment. Alignment depended on eyesight, experience, and patience. Press-fitting depended on operator feel and hydraulic control. Consistency could drift not because people were careless, but because human force, attention, and perception naturally vary. The new system addresses that variation directly. It converts a maintenance requirement into a machine-executable process, and it uses industrial robots to hold that process inside a narrow tolerance band.
The phrase I keep returning to is “micron-level intelligent manufacturing.” I do not use it as a slogan. I use it because the measurements, motions, and decisions in this wheel-axle line now operate at a scale where small errors matter. A wheel-axle assembly is part of the running gear, and its fit, alignment, and tightening condition influence vibration, wear, thermal behavior, and long-term reliability. When industrial robots control the critical motions, I can see the difference in the data. The process becomes less dependent on chance and more dependent on verified parameters.
The closed-loop wheel-axle process
I think of the wheel-axle line as four connected stages. The first stage measures the axle diameter and related geometry. The second stage uses that measurement to select the correct mating component. The third stage performs precision press-fitting. The fourth stage runs a running-in test and records the result. Each stage feeds the next, and each stage also feeds the traceability database. If I want to understand why a particular wheel set behaved in a certain way, I can reconstruct the sequence from the stored data.
| Stage | Primary action | Controlled variable | Output | Role of industrial robots |
|---|---|---|---|---|
| Axle diameter measurement | Capture geometric dimensions with digital instruments | Diameter, roundness, taper, surface condition | Measured value and uncertainty record | Positioning and repeatable presentation of the workpiece |
| Intelligent matching | Select the best mating part from measured data | Interference, clearance, fit class | Match decision and pairing identifier | Handling and sorting of matched components |
| Precision press-fitting | Apply controlled force and displacement | Force, speed, alignment, final position | Press-fit curve and acceptance result | Six-axis motion, alignment, and force-guided insertion |
| Running-in test | Rotate and monitor the assembly under load | Torque, temperature, vibration, noise | Test signature and release decision | Loading, positioning, and repeatable cycling |
The closed loop is not only mechanical. It is also informational. I can define the process state as a vector of measured values, machine commands, and quality outcomes. If I denote the measurement vector as $$\mathbf{m} = [d_1, d_2, \ldots, d_n]^T$$ and the process command vector as $$\mathbf{u} = [f, v, x, \theta]^T$$, then the line attempts to find a control policy that minimizes error while satisfying safety and quality constraints. In practical terms, I do not need to solve a complicated optimization by hand. The system uses rules, calibration data, and feedback to keep the process inside its validated envelope.
$$ \min_{\mathbf{u}} \; J = \sum_{i=1}^{n} w_i \left( y_i(\mathbf{u}) – y_i^{ref} \right)^2 + \lambda \|\mathbf{u}\|^2 $$
In that expression, $$y_i(\mathbf{u})$$ represents a measured outcome such as press-fit force or final displacement, $$y_i^{ref}$$ is the reference target, $$w_i$$ is a weighting factor, and $$\lambda$$ penalizes excessive control effort. The formula is a compact way of saying that the wheel-axle line does not simply push parts together. It balances accuracy, stability, and machine effort. Industrial robots are the physical agents that execute the chosen motion, but the logic behind the motion comes from the measured data.
Why manual assembly created risk
Before this system, I often saw the same pattern in manual wheel-axle assembly. The operator had to lift or guide a heavy component, align it visually, start the press, watch the force gauge, and judge when the part had seated correctly. Each step introduced a possible deviation. The force might rise too quickly. The part might tilt slightly. The lubrication condition might vary. The operator might compensate for one problem and create another. None of these issues necessarily caused an immediate failure, but together they created an environment where consistency depended on individual skill and daily condition.
The risk was not imaginary. Wheel-axle assemblies operate in a harsh mechanical environment. They experience dynamic loads, vibration, temperature cycles, and long service intervals. A fit that is too loose can lead to relative motion, impact, and wear. A fit that is too tight can create excessive stress, damage surfaces, or make future disassembly difficult. The target is a narrow window, and manual processes can wander outside that window even when everyone is trying to do the right thing. Industrial robots help hold the process near the center of the window rather than letting it drift toward the edges.
| Manual risk | Physical consequence | Data consequence | How intelligent automation responds |
|---|---|---|---|
| Uneven pressing force | Surface damage, incomplete seating, residual stress | Force curve lacks repeatability | Closed-loop force and position control with industrial robots |
| Misalignment during insertion | Scoring, galling, seal damage, vibration | Alignment deviation is poorly documented | Six-axis correction and vision-assisted positioning |
| Inconsistent tightening | Loosening, fatigue, joint failure | Torque records are incomplete | Smart tightening tools with automatic recording |
| Operator fatigue | Slower cycle time, variable judgment | Human factors are invisible in the record | Industrial robots take over heavy, repetitive motions |
| Manual data entry | Lost traceability, delayed correction | Errors and omissions accumulate | Automatic acquisition and lifecycle traceability |
I also noticed that manual processes make it difficult to learn systematically. When a problem appears, I can ask what happened, but the answer may depend on memory, handwritten notes, or a vague impression. The new line turns every important action into a timestamped record. That record is not just paperwork. It is the raw material for improvement. I can compare press-fit curves across dozens of wheel sets. I can see whether a change in supplier, lubrication, or temperature shifts the process. I can detect drift before it becomes a defect. Industrial robots make this possible because they execute the same motion repeatedly and report the same variables every time.
The six-axis industrial robot and micron-level motion
The center of the wheel-axle line is a six-axis industrial robot. I have watched it move through a sequence that looks simple from a distance: approach, align, insert, press, release, and retract. Up close, the sequence is a carefully tuned composition of joint motions, tool-center-point paths, force limits, and safety envelopes. The robot’s motion control accuracy has been refined to the micron level. That level of accuracy is not achieved by buying a robot and turning it on. It comes from repeated tuning of trajectories and interlock logic, often after thousands of test cycles.
When I stand near the cell, I can see how the robot compensates for small variations. It does not simply follow a fixed path with blind confidence. It uses feedback from measurement devices and force sensors. If the component is slightly tilted, the robot can adjust. If the press force rises faster than expected, the controller can slow the insertion. If the final position is outside the target band, the system can stop and signal an exception. This is the difference between a programmable machine and an intelligent process. The industrial robots are programmable, but the surrounding system gives them awareness.
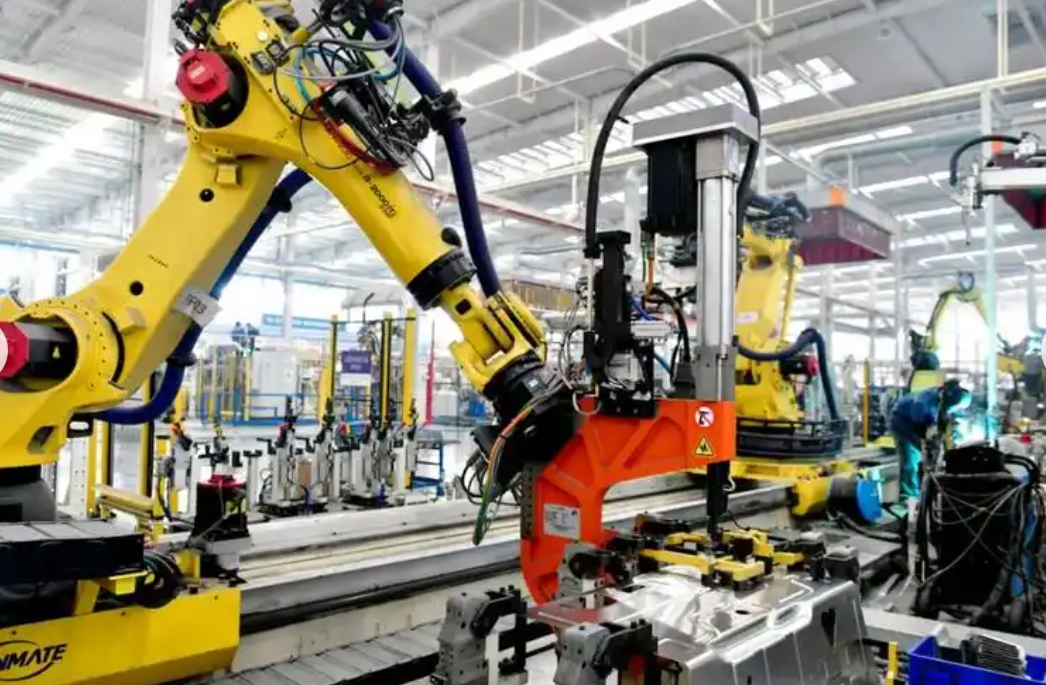
From a control perspective, I picture the robot as a dynamic system. Its joints have mass, inertia, compliance, and friction. The controller must calculate the torque needed to follow a desired trajectory while rejecting disturbances. A simplified dynamic model can be written as follows:
$$ M(\mathbf{q})\ddot{\mathbf{q}} + C(\mathbf{q}, \dot{\mathbf{q}})\dot{\mathbf{q}} + G(\mathbf{q}) + \mathbf{f}_f(\dot{\mathbf{q}}) = \boldsymbol{\tau} $$
Here, $$\mathbf{q}$$ is the joint position vector, $$M(\mathbf{q})$$ is the inertia matrix, $$C(\mathbf{q}, \dot{\mathbf{q}})$$ captures Coriolis and centrifugal effects, $$G(\mathbf{q})$$ is gravity loading, $$\mathbf{f}_f(\dot{\mathbf{q}})$$ represents friction, and $$\boldsymbol{\tau}$$ is the commanded joint torque. The controller compares the desired joint trajectory $$\mathbf{q}_d(t)$$ with the actual trajectory $$\mathbf{q}(t)$$ and computes an error:
$$ \mathbf{e}(t) = \mathbf{q}_d(t) – \mathbf{q}(t) $$
The goal is to keep $$\|\mathbf{e}(t)\|$$ as small as possible throughout the critical insertion and press-fitting phases. In the wheel-axle process, a small trajectory error can translate into a misaligned fit, an uneven load, or a surface defect. That is why the motion control accuracy is described as micron-level. It is not a marketing phrase. It is a requirement derived from the mechanics of the assembly.
| Robot characteristic | Why it matters in wheel-axle work | Typical control consideration | Observed benefit |
|---|---|---|---|
| Six axes | Allows complex alignment and insertion angles | Inverse kinematics and singularity avoidance | Flexible positioning without manual re-fixturing |
| Micron-level motion accuracy | Controls fit and surface contact | Encoder resolution, calibration, thermal compensation | Repeatable press-fit results |
| Force sensing | Prevents excessive load and detects seating | Impedance or force control | Lower risk of damage during insertion |
| High repeatability | Reduces variation between wheel sets | Path planning and trajectory smoothing | Stable quality across shifts |
| High-speed communication | Coordinates robot, tools, and sensors | Deterministic network timing | Fast response to abnormal conditions |
The precision also affects how I think about safety. When industrial robots operate near heavy components, safety is not only about preventing collisions. It is also about preventing subtle mechanical damage that might not appear until the vehicle has been in service for months. A micron-level process reduces the probability of hidden defects. It makes the quality of the wheel-axle assembly more predictable. I can release a wheel set with greater confidence because the critical variables have been measured, controlled, and recorded.
Press-fit mechanics and reliability
To understand why the robot’s accuracy matters, I need to think about the press-fit itself. The fit between the axle and the mating component is created by controlled interference. If the interference is $$\delta$$, then a simplified relationship can be expressed as:
$$ \delta = d_{shaft} – D_{hole} $$
The press force depends on the interference, the contact length, the friction coefficient, and the elastic properties of the materials. A simplified engineering estimate is:
$$ F_p \approx \pi d L p \mu $$
where $$d$$ is the nominal diameter, $$L$$ is the contact length, $$p$$ is the contact pressure, and $$\mu$$ is the friction coefficient. In practice, the relationship is more complex because the geometry, surface finish, lubrication, and material behavior all influence the result. However, the formula helps me remember that press-fitting is a force-controlled and displacement-controlled process. If the force rises too quickly for a given displacement, something may be misaligned or too tight. If the force remains too low, the fit may be insufficient. The intelligent system monitors both force and displacement and compares the resulting curve with a validated envelope.
The probability of successful seating can be expressed in a simplified reliability form:
$$ P_s = P(F_p > F_{req}) $$
where $$F_{req}$$ is the minimum required seating force. A robust process does not aim to barely exceed $$F_{req}$$. It aims to operate with a margin that accounts for material variation, temperature, and measurement uncertainty. The system therefore maintains a target window:
$$ F_{min} \leq F_p \leq F_{max} $$
and a corresponding displacement window:
$$ x_{min} \leq x_p \leq x_{max} $$
When both conditions are satisfied, the wheel set can proceed. When either condition is violated, the system stops and requests intervention. This is how industrial robots contribute to safety. They do not make the engineering decision by themselves. They execute the process with enough precision that the decision can be based on trustworthy data.
| Variable | Symbol | Target condition | Risk if outside target |
|---|---|---|---|
| Interference | $$\delta$$ | Within specified fit class | Loose fit or excessive stress |
| Press force | $$F_p$$ | $$F_{min} \leq F_p \leq F_{max}$$ | Damage, incomplete seating, or weak joint |
| Displacement | $$x_p$$ | $$x_{min} \leq x_p \leq x_{max}$$ | Incorrect axial position |
| Alignment error | $$\epsilon_a$$ | Below tolerance | Scoring, vibration, uneven load |
| Temperature | $$T$$ | Within process window | Thermal expansion changes fit |
I have seen how the use of industrial robots reduces the variability that comes from human force. A person can be highly skilled, but a person cannot reproduce exactly the same force curve hundreds of times without fatigue. A robot can. That does not mean the robot is always right. It means the robot is consistent, and consistency is the foundation of statistical process control. Once I have consistency, I can measure capability and improve it.
One useful metric is process capability:
$$ C_p = \frac{USL – LSL}{6\sigma} $$
Here, $$USL$$ is the upper specification limit, $$LSL$$ is the lower specification limit, and $$\sigma$$ is the process standard deviation. A higher $$C_p$$ indicates that the process spread is small relative to the tolerance band. The micron-level motion of industrial robots helps reduce $$\sigma$$. When $$\sigma$$ becomes smaller, the process can meet tighter specifications without increasing the defect rate.
Another useful metric is the capability index that accounts for centering:
$$ C_{pk} = \min\left( \frac{USL – \mu}{3\sigma}, \frac{\mu – LSL}{3\sigma} \right) $$
where $$\mu$$ is the process mean. I care about $$C_{pk}$$ because a process can have a small spread but still be off-center. The intelligent wheel-axle line uses measurement feedback to keep the mean close to the target, not just to reduce variation. Industrial robots provide the repeatable motion, and the data system provides the feedback needed for centering.
Cycle time and throughput
The practical benefit I notice most quickly is time. A single wheel-set assembly now takes twelve minutes less than the traditional mode. That sounds like a simple improvement, but in a maintenance depot it changes the rhythm of the entire operation. Twelve minutes saved on one wheel set becomes hours saved across a fleet program. It reduces the pressure on the workshop, shortens the time a vehicle spends out of service, and allows the team to use the same space and labor for more work.
The basic relationship is straightforward:
$$ \Delta T = T_{manual} – T_{robot} $$
If $$T_{manual}$$ is the traditional assembly time and $$T_{robot}$$ is the intelligent assembly time, then $$\Delta T$$ is the saving. Throughput can be estimated as:
$$ Q = \frac{3600}{T_{cycle}} $$
where $$Q$$ is the number of cycles per hour and $$T_{cycle}$$ is the cycle time in seconds. When $$T_{cycle}$$ decreases, $$Q$$ increases. The improvement is not linear in every real workshop because of setup, logistics, and testing constraints, but the direction is clear. The intelligent line increases the capacity of the same physical area.
| Metric | Traditional mode | Intelligent mode | Change |
|---|---|---|---|
| Single wheel-set assembly time | $$T_{manual}$$ | $$T_{robot}$$ | Reduced by 12 minutes |
| Process consistency | Operator-dependent | Data-controlled | Improved |
| Traceability | Manual records | Automatic lifecycle record | Complete and timely |
| Heavy manual handling | High | Low | Reduced fatigue and injury risk |
| Exception response | Human observation | Millisecond-level alarm | Faster intervention |
I also look at the time saved per fleet campaign. If a campaign involves $$N$$ wheel sets, the total saving is approximately:
$$ T_{saved} = N \Delta T $$
For example, if $$\Delta T = 12$$ minutes and $$N = 100$$, the total saving is $$1200$$ minutes, or $$20$$ hours. That is equivalent to more than two working days of capacity. The exact numbers depend on the workshop schedule, but the arithmetic shows why the deployment matters. Industrial robots are not only a technical upgrade. They are a capacity multiplier.
The intelligent assurance system behind the robot
When I look behind the moving arm, I see a complete intelligent assurance system. The robot is the most visible element, but it is not the only element. Digital micrometers and stamp scanners work synchronously to capture dimensional data and identity marks. The data is collected automatically and linked to a lifecycle record. High-speed communication interfaces connect devices that would otherwise be isolated. Precision tightening equipment and AI vision systems act as electronic supervisors, detecting abnormal conditions and triggering alarms or interventions within milliseconds.
This architecture can be described as a layered control and information system. The physical layer includes industrial robots, presses, tools, and fixtures. The sensor layer includes micrometers, scanners, force sensors, vision cameras, and temperature sensors. The control layer includes programmable logic controllers, robot controllers, and safety interlocks. The information layer includes databases, traceability services, and analytics. The decision layer includes rules, models, and human review. Each layer supports the one above it, and data flows both upward and downward.
| Layer | Key elements | Function | Contribution to safety and quality |
|---|---|---|---|
| Physical | Industrial robots, press, fixtures, conveyors | Execute motion and force | Repeatable, controlled assembly |
| Sensor | Digital micrometers, scanners, force sensors, AI vision | Measure and observe | Detect deviation before release |
| Control | Robot controllers, PLCs, safety interlocks | Coordinate actions | Prevent unsafe or invalid sequences |
| Information | Traceability database, lifecycle record | Store and link data | Enable audit and root-cause analysis |
| Decision | Rules, analytics, human review | Accept, reject, or improve | Support continuous learning |
One of the most valuable features is automatic data acquisition. In the past, I sometimes saw important measurements written on paper and later entered into a system. That process was vulnerable to transcription errors and delays. Now the measurement goes directly into the digital record. The identity of the component is captured by a scanner. The press-fit curve is stored with a timestamp. The tightening result is linked to the wheel set. The running-in test result is attached to the same record. I can retrieve the complete history without searching through multiple files.
Traceability can be represented as a chain of linked records:
$$ H_i = h(D_i, H_{i-1}) $$
where $$D_i$$ is the data block for step $$i$$, $$H_{i-1}$$ is the previous hash or identifier, and $$H_i$$ is the resulting traceability record. This kind of chained structure makes it difficult to alter history without detection. I do not need to explain the cryptography to every operator, but the principle is important: the maintenance record becomes trustworthy. If a question arises later, I can trace the wheel set back through measurement, matching, pressing, tightening, and testing.
The high-speed communication interface is another quiet but essential part of the system. If devices cannot exchange data quickly, the line cannot react quickly. Communication latency can be modeled as:
$$ T_{comm} = T_{tx} + T_{prop} + T_{rx} + T_{proc} $$
where $$T_{tx}$$ is transmission time, $$T_{prop}$$ is propagation time, $$T_{rx}$$ is reception time, and $$T_{proc}$$ is processing time. In a modern industrial network, these values are small, but they are not zero. The design of the network determines whether the system can meet its response requirements. When an AI vision system detects an anomaly, the alarm must reach the controller and the operator quickly enough to prevent further processing. Milliseconds matter in that moment.
AI vision and millisecond-level intervention
The AI vision system acts like an electronic inspector. It does not get tired, and it does not lose attention after a long shift. It examines the component, the alignment, or the completed assembly and compares what it sees with learned patterns. If the pattern is abnormal, it raises a flag. The system can then pause the industrial robots, stop the press, or alert the operator. The goal is not to replace human inspection entirely. The goal is to add a fast, consistent layer of screening that catches issues before they propagate.
I can describe the detection process with a simple probability framework. Let $$TP$$ be true positives, $$FP$$ be false positives, $$TN$$ be true negatives, and $$FN$$ be false negatives. Precision and recall are:
$$ \text{Precision} = \frac{TP}{TP + FP} $$
$$ \text{Recall} = \frac{TP}{TP + FN} $$
In a safety-critical maintenance process, I want high recall so that defects are not missed. I also want high precision so that the line does not stop unnecessarily. The AI vision system is tuned to balance these goals. When it detects an anomaly, the alarm latency is the sum of several delays:
$$ L_{alarm} = t_{capture} + t_{infer} + t_{comm} + t_{actuate} $$
Here, $$t_{capture}$$ is image acquisition time, $$t_{infer}$$ is inference time, $$t_{comm}$$ is communication time, and $$t_{actuate}$$ is the time needed to stop or adjust the machine. Reducing any of these terms improves the response. High-speed communication and edge processing help keep the total latency in the millisecond range.
| Monitoring device | What it checks | Typical abnormal condition | Response |
|---|---|---|---|
| Digital micrometer | Axle diameter and geometry | Out-of-tolerance measurement | Reject or rework before assembly |
| Stamp scanner | Component identity and traceability | Missing or unreadable mark | Hold and request verification |
| Force sensor | Press-fit force and displacement | Force curve outside envelope | Stop press, alert operator |
| Smart tightening tool | Torque and angle | Under-torque or over-torque | Record result and prevent release |
| AI vision | Alignment, surface, presence of features | Misalignment or defect | Pause industrial robots and notify |
I appreciate the way the system uses alarms. An alarm is not merely a light on a panel. It is a data event with a timestamp, a reason code, and a link to the affected wheel set. When I investigate an alarm, I can see the exact condition that triggered it. I can compare it with previous events. I can determine whether the cause was a measurement outlier, a tool drift, a component variation, or a process setting. This turns troubleshooting from a guessing exercise into an evidence-based activity.
Human-machine collaboration and AI gatekeeping
The new model is often described as human-machine collaboration with AI gatekeeping. I think that description is accurate. The industrial robots perform the heavy, repetitive, and high-precision motions. The AI systems monitor the process and act as gatekeepers. The human operators supervise, troubleshoot, make decisions, and improve the process. The human is not removed from the loop. The human is moved to a higher-value position in the loop.
Before automation, the operator might spend much of the shift lifting, positioning, holding, and forcing components. That work is physically demanding and can lead to fatigue, strain, and long-term occupational health issues. After automation, the operator monitors dashboards, responds to exceptions, and performs tasks that require judgment. The work environment improves. The operator’s attention can be focused on quality rather than on surviving the physical workload.
I can express the ergonomic benefit in a simplified way. If the manual handling load is $$W_m$$ and the automated handling load is $$W_a$$, then the reduction is:
$$ \Delta W = W_m – W_a $$
The percentage reduction is:
$$ R_W = \frac{W_m – W_a}{W_m} \times 100\% $$
Similarly, if the repetitive motion count per cycle is $$N_m$$ for manual work and $$N_a$$ for automated work, the reduction is:
$$ \Delta N = N_m – N_a $$
These formulas are simple, but they capture an important truth. Industrial robots take over the motions that harm human bodies. They do not eliminate the need for human skill. They redirect that skill toward supervision, diagnostics, and improvement.
| Activity | Traditional role | Intelligent role | Human benefit |
|---|---|---|---|
| Heavy lifting | Manual or assisted | Industrial robots handle the load | Reduced physical strain |
| Alignment | Visual and manual | Robot and vision system align | Less guesswork |
| Press-fitting | Manual control | Closed-loop force and position | Safer and more consistent |
| Inspection | Human observation | AI vision plus human review | Faster detection and fewer missed defects |
| Record keeping | Manual entry | Automatic traceability | Less administrative burden |
I also see how standardization and data governance make the work more reliable. Every wheel set follows the same validated sequence. Every critical measurement is captured in the same format. Every exception is handled through the same escalation path. This does not make the work rigid. It makes the work repeatable. When a process is repeatable, it can be studied, compared, and improved. When it is not repeatable, every improvement is difficult to verify.
The standardization can be represented as a set of process constraints:
$$ g_j(\mathbf{x}) \leq 0, \quad j = 1, 2, \ldots, m $$
where $$\mathbf{x}$$ is the vector of process variables. Each constraint represents a requirement, such as maximum force, minimum displacement, safe temperature, or acceptable alignment error. The intelligent system ensures that the process stays within the feasible region. If a constraint is about to be violated, the system intervenes. Industrial robots provide the actuation needed to enforce the constraints in real time.
From one robot to a fleet of industrial robots
The wheel-axle robot is not the first industrial robot in this maintenance environment. Earlier, in December 2024, robots adapted for traction motor and brake cylinder repair were put into operation in a vehicle overhaul workshop. Those robots proved that automated maintenance could work in a heavy rail vehicle context. They handled tasks that required strength, precision, and repeatability. The wheel-axle robot now joins them, and together they form the beginning of a multi-process robot fleet.
I find this fleet concept important. A single robot cell can improve one process. A fleet of industrial robots can change the operating model of an entire workshop. When multiple robots cover multiple core processes, the workshop can shift from labor-intensive to technology-intensive. The human team becomes a team of supervisors, analysts, and technicians who manage a connected production system. The physical work is increasingly done by machines, while the cognitive work is done by people and intelligent software.
| Robot application | Core process | Primary benefit | Stage of deployment |
|---|---|---|---|
| Traction motor repair robot | Motor maintenance and assembly | Precision and repeatability | In operation since December 2024 |
| Brake cylinder repair robot | Cylinder maintenance and testing | Consistent force and safety | In operation since December 2024 |
| Wheel-axle intelligent industrial robot | Measurement, matching, press-fit, running-in | Closed-loop precision and traceability | Recently commissioned |
| Future inspection robot | Visual and dimensional inspection | Fast, repeatable screening | Planned or under development |
| Future logistics robot | Component movement and kitting | Reduced manual handling | Planned or under development |
I can estimate the automation ratio of a process with a simple formula:
$$ A = \frac{T_{auto}}{T_{total}} \times 100\% $$
where $$T_{auto}$$ is the time spent in automated operations and $$T_{total}$$ is the total process time. As more industrial robots are added, $$A$$ increases. The goal is not necessarily to reach 100 percent. The goal is to automate the tasks where precision, safety, and repeatability matter most, while preserving human oversight where judgment and adaptability are essential.
Another useful metric is the robot utilization rate:
$$ U = \frac{T_{active}}{T_{available}} \times 100\% $$
where $$T_{active}$$ is the time the robot is performing useful work and $$T_{available}$$ is the time it is available for production. High utilization means the capital investment is being used effectively. It also means the process design must keep the robot supplied with work, fixtures, and components. A robot that waits for parts is not delivering its full value. The intelligent line addresses this by connecting measurement, matching, and assembly into a continuous flow.
Data, lifecycle traceability, and predictive maintenance
The data collected by the wheel-axle line has value beyond the immediate assembly decision. It becomes part of a lifecycle record. I can use that record to understand how a wheel set performs over time. I can link maintenance data with service data. I can look for patterns that precede failures. I can compare different batches, suppliers, or operating conditions. This is the foundation of predictive maintenance.
Reliability can be modeled with the exponential distribution as a first approximation:
$$ R(t) = e^{-\lambda t} $$
where $$\lambda$$ is the failure rate and $$t$$ is time. The mean time between failures is:
$$ MTBF = \frac{1}{\lambda} $$
When maintenance data is accurate, I can estimate $$\lambda$$ more reliably. I can also identify whether a process change has reduced $$\lambda$$. If the wheel-axle press-fit is more consistent, the long-term failure rate may decrease. If the tightening is more accurate, the risk of loosening may decrease. These are not immediate effects that appear in the first week. They accumulate over months and years. The traceability record makes it possible to detect them.
| Data category | Example variables | Immediate use | Long-term use |
|---|---|---|---|
| Dimensional | Diameter, roundness, taper | Matching and fit selection | Supplier and wear analysis |
| Process | Force, displacement, speed, torque | Accept or reject the assembly | Process capability and drift detection |
| Tool | Calibration date, tool identity, cycle count | Ensure valid tooling | Maintenance planning |
| Environmental | Temperature, humidity, cleanliness | Adjust process if needed | Correlate environment with quality |
| Operator | Intervention type, response time | Support and escalation | Training and human factors improvement |
I can also think about the value of data in terms of uncertainty reduction. If a measurement has uncertainty $$u$$, the combined uncertainty from several sources can be estimated as:
$$ u_c = \sqrt{u_1^2 + u_2^2 + \cdots + u_n^2} $$
When instruments are calibrated and data is captured automatically, $$u_c$$ is better understood. I know how much confidence to place in a measurement. I can set acceptance limits that account for uncertainty rather than ignoring it. This is especially important in wheel-axle work, where a few microns can change the fit condition.
Predictive maintenance uses condition data to estimate future behavior. A simple degradation model can be written as:
$$ D(t) = D_0 + \alpha t + \beta t^2 + \epsilon(t) $$
where $$D(t)$$ is the degradation indicator, $$D_0$$ is the initial condition, $$\alpha$$ and $$\beta$$ are coefficients, and $$\epsilon(t)$$ is noise. When enough data is available, the model can estimate when the degradation will exceed a threshold. The maintenance team can then plan intervention before failure. Industrial robots contribute to this capability by producing consistent process data that makes degradation modeling more reliable.
Quality assurance formulas and process control
I use several formulas to summarize the quality performance of the wheel-axle line. These formulas help me communicate with colleagues who prefer numbers over descriptions. They also help me compare the intelligent process with the previous manual process.
Defect rate:
$$ DR = \frac{N_d}{N_t} \times 100\% $$
where $$N_d$$ is the number of defective units and $$N_t$$ is the total number of units. Lower is better.
First-pass yield:
$$ FPY = \frac{N_g}{N_t} \times 100\% $$
where $$N_g$$ is the number of units that pass without rework. Higher is better.
Overall equipment effectiveness:
$$ OEE = A \times P \times Q $$
where $$A$$ is availability, $$P$$ is performance, and $$Q$$ is quality. Each factor is expressed as a fraction. The intelligent wheel-axle line aims to improve all three. Availability improves when industrial robots reduce unplanned manual delays. Performance improves when cycle time is shorter. Quality improves when precision and traceability are higher.
| Metric | Formula | Interpretation | Direction of improvement |
|---|---|---|---|
| Defect rate | $$DR = N_d / N_t \times 100\%$$ | Share of defective units | Lower |
| First-pass yield | $$FPY = N_g / N_t \times 100\%$$ | Share of units passing without rework | Higher |
| Process capability | $$C_p = (USL – LSL) / (6\sigma)$$ | Spread relative to tolerance | Higher |
| Centered capability | $$C_{pk} = \min\left( \frac{USL – \mu}{3\sigma}, \frac{\mu – LSL}{3\sigma} \right)$$ | Spread and centering | Higher |
| Overall equipment effectiveness | $$OEE = A \times P \times Q$$ | Combined equipment performance | Higher |
Statistical process control is also part of the picture. I can monitor a critical variable, such as press-fit force, using a control chart. The center line is the mean:
$$ \bar{x} = \frac{1}{n} \sum_{i=1}^{n} x_i $$
The sample standard deviation is:
$$ s = \sqrt{\frac{1}{n-1} \sum_{i=1}^{n} (x_i – \bar{x})^2} $$
Control limits can be estimated as:
$$ UCL = \bar{x} + 3s $$
$$ LCL = \bar{x} – 3s $$
If a point falls outside these limits, or if a non-random pattern appears, I investigate. The industrial robots and sensors provide the data stream that makes this monitoring possible. In the past, I might only see a final pass or fail result. Now I can see the entire process signature and detect small shifts before they become defects.
Safety, risk, and human oversight
Safety is not only about preventing accidents around moving machinery. It is also about ensuring that the maintenance work itself produces a safe vehicle. The wheel-axle assembly is part of the running gear, so a defect can affect the safety of the train and its passengers. I take that responsibility seriously. The intelligent system helps me fulfill it by enforcing validated sequences, recording critical data, and preventing release when conditions are not met.
A simplified risk model can be written as:
$$ Risk = P(F) \times S(F) $$
where $$P(F)$$ is the probability of failure and $$S(F)$$ is the severity of failure. Industrial robots reduce $$P(F)$$ by improving consistency and reducing human error. The AI inspection and traceability systems help detect problems before release, which further reduces the probability of an undetected defect reaching service. The severity term is determined by the nature of the failure, but reducing probability is a direct safety contribution.
| Risk source | Probability reduction mechanism | Severity control | Human oversight |
|---|---|---|---|
| Measurement error | Digital instruments and automatic data capture | Reject out-of-tolerance parts | Review anomalies and calibration |
| Misalignment | Six-axis correction and vision guidance | Stop before damage occurs | Inspect and reset if needed |
| Incorrect press force | Closed-loop force and position control | Prevent excessive or insufficient fit | Analyze force curves |
| Incomplete tightening | Smart tightening tools with recording | Prevent release of unverified joints | Audit torque records |
| Hidden surface damage | AI vision and process monitoring | Detect and quarantine | Verify with human inspection |
I believe human oversight remains essential. Industrial robots are very good at following a validated process, but they do not understand the broader context in the same way a human does. They do not know that a particular batch of components has a history of variation, or that a nearby operation has changed, or that a maintenance manual has been updated. Human operators connect the machine data to the real world. They interpret alarms, make judgment calls, and decide when to escalate. The best results come from combining the repeatability of industrial robots with the contextual awareness of people.
Economic and operational value
From an operational perspective, the value of the intelligent wheel-axle line appears in several forms. The most obvious is time saving. The next is quality improvement. The next is risk reduction. There are also benefits related to workforce health, data quality, and long-term maintainability. I can summarize these benefits in a value table.
| Value category | Mechanism | Short-term effect | Long-term effect |
|---|---|---|---|
| Cycle time | Automated handling, alignment, pressing | Twelve minutes saved per wheel set | Higher workshop capacity |
| Quality | Micron-level motion and closed-loop control | Fewer immediate defects | Lower life-cycle failure risk |
| Traceability | Automatic data capture and lifecycle record | Faster release decisions | Better root-cause analysis |
| Safety | AI monitoring and interlock systems | Faster alarm response | Reduced accident and defect risk |
| Workforce | Industrial robots handle heavy repetitive work | Less fatigue | Improved occupational health |
| Knowledge | Data-driven process learning | Better troubleshooting | Continuous improvement culture |
I can also estimate the economic benefit of reduced cycle time using a simple model. Let $$C_h$$ be the hourly cost of the workshop, and let $$T_{saved}$$ be the total hours saved. The direct labor and capacity benefit is approximately:
$$ B_{time} = C_h \times T_{saved} $$
If the line also reduces defect-related rework, the benefit is:
$$ B_{quality} = C_r \times N_r $$
where $$C_r$$ is the average cost per rework event and $$N_r$$ is the number of rework events avoided. The total benefit is:
$$ B_{total} = B_{time} + B_{quality} + B_{safety} + B_{traceability} $$
Some benefits, such as safety and traceability, are difficult to monetize precisely. That does not make them less important. In a safety-critical railway environment, avoiding a single serious failure can justify a significant investment. The intelligent wheel-axle line is therefore not only a productivity project. It is a risk management project.
Implementation lessons I have learned
I have learned several lessons from watching this deployment. The first is that the process must be understood before it is automated. Industrial robots cannot compensate for a poorly defined process. The team had to study the wheel-axle assembly carefully, identify the critical variables, and define the acceptable windows. Only then could the robots and control systems be configured effectively.
The second lesson is that data must be designed into the process from the beginning. If traceability is added as an afterthought, it becomes incomplete and difficult to use. In this line, measurement, identification, pressing, tightening, and testing are all connected to the same data architecture. That makes the record complete and useful.
The third lesson is that people must be involved in the transition. Operators and technicians need to understand how the industrial robots work, how to respond to alarms, and how to use the data. The goal is not to remove human expertise. The goal is to give human expertise better tools.
The fourth lesson is that maintenance of the automated system itself matters. Industrial robots require calibration, preventive maintenance, software updates, and performance monitoring. If the robot drifts, the process drifts. A robust maintenance strategy for the automation is therefore essential. I think of it as maintaining the maintainers.
| Lesson | What I observed | Action principle |
|---|---|---|
| Define the process first | Automation succeeds when the critical variables are known | Map the process before programming industrial robots |
| Design data into the workflow | Automatic capture makes traceability reliable | Integrate sensors and databases from the start |
| Keep people involved | Human judgment is needed for exceptions | Train operators as supervisors and analysts |
| Maintain the automation | Calibration and software health affect quality | Apply preventive maintenance to industrial robots |
| Measure the benefits | Cycle time, quality, and safety improvements are visible in data | Use KPIs to guide further development |
A future roadmap for industrial robots in maintenance
I see the wheel-axle project as part of a longer journey. The future roadmap will likely include more industrial robots, more sensors, more AI, and deeper integration between maintenance and operations. The goal is to create a workshop where machines perform the precise, repetitive, and heavy work, while people focus on planning, diagnosis, and improvement.
A phased roadmap can be summarized as follows.
| Phase | Focus | Key actions | Expected outcome |
|---|---|---|---|
| Phase 1 | Single-process automation | Deploy industrial robots for wheel-axle assembly | Precision, speed, traceability |
| Phase 2 | Multi-process robot fleet | Connect motor, brake, and wheel-axle cells | Integrated maintenance flow |
| Phase 3 | Data-driven predictive maintenance | Use lifecycle data for failure prediction | Fewer unplanned failures |
| Phase 4 | Digital twin and simulation | Model the workshop and optimize schedules | Higher capacity and resilience |
| Phase 5 | Autonomous maintenance ecosystem | Coordinate industrial robots, logistics, and AI | Self-optimizing maintenance operations |
A digital twin is a virtual representation of the physical process. It can be updated with real-time data from the wheel-axle line. I can use it to simulate changes before applying them. For example, I can test a new press-fit profile in the digital twin and see how it affects cycle time, force, and quality. If the simulation looks promising, I can validate it on the physical line with a controlled trial. This reduces the risk of experimenting directly on production equipment.
The digital twin can be described as a state-space model:
$$ \dot{\mathbf{x}} = f(\mathbf{x}, \mathbf{u}, \boldsymbol{\theta}) $$
$$ \mathbf{y} = g(\mathbf{x}, \mathbf{u}, \boldsymbol{\theta}) $$
where $$\mathbf{x}$$ is the system state, $$\mathbf{u}$$ is the control input, $$\boldsymbol{\theta}$$ is the parameter vector, and $$\mathbf{y}$$ is the measured output. The model can be calibrated with data from the real line. Industrial robots provide precise motion data that helps keep the model accurate. The model can then be used for prediction, optimization, and training.
I also expect to see more collaborative robots in the future. Collaborative industrial robots can work alongside people without full physical separation, provided that safety requirements are met. They could assist with inspection, kitting, or light assembly tasks. This would further reduce manual handling and improve flexibility. The wheel-axle robot is a large, powerful machine, but not every maintenance task requires that size. A mix of large industrial robots and smaller collaborative robots may be the best solution.
Key performance indicators I would track
If I were responsible for the ongoing performance of this line, I would track a focused set of key performance indicators. These indicators would cover safety, quality, delivery, cost, and morale. They would be reviewed regularly and used to guide improvement. The wheel-axle line generates enough data to make this practical.
| KPI | Definition | Formula | Target direction |
|---|---|---|---|
| Safety incident rate | Incidents per exposure hours | $$SIR = N_i / H_e \times 200000$$ | Lower |
| First-pass yield | Units passing without rework | $$FPY = N_g / N_t \times 100\%$$ | Higher |
| Cycle time | Time per wheel-set assembly | $$T_c = T_{finish} – T_{start}$$ | Lower |
| OEE | Availability, performance, quality | $$OEE = A \times P \times Q$$ | Higher |
| Robot utilization | Active time over available time | $$U = T_{active} / T_{available}$$ | Higher |
| Traceability completeness | Records with all required data | $$TC = N_{complete} / N_{total} \times 100\%$$ | Higher |
| Alarm response time | Time from detection to action | $$L_{alarm} = t_{capture} + t_{infer} + t_{comm} + t_{actuate}$$ | Lower |
I would also track the cost of poor quality. This includes rework, scrap, warranty claims, and unplanned downtime. A simple form is:
$$ COPQ = C_{rework} + C_{scrap} + C_{warranty} + C_{downtime} $$
When industrial robots improve first-pass yield, the cost of poor quality tends to fall. When traceability improves, warranty investigations become faster and more accurate. When predictive maintenance works, unplanned downtime decreases. These effects reinforce one another.
Final reflections from my first-person perspective
When I walk through the wheel-axle area now, I see a process that feels different from the old one. The heavy lifting is done by industrial robots. The measurement is digital. The press-fit curve is displayed and recorded. The AI vision system watches for anomalies. The tightening tools report their results automatically. The running-in test produces a signature that can be compared with historical data. The human operators move between screens, fixtures, and exception stations, using their experience to keep the system healthy and improve it.
I do not think the goal is to create a workshop without people. I think the goal is to create a workshop where people are not exhausted by heavy, repetitive work and where machines handle the tasks that require micron-level consistency. Industrial robots are not magic. They need good process design, good maintenance, and good data. But when those conditions are met, they can transform the reliability and capacity of maintenance operations.
The wheel-axle intelligent industrial robot is a clear example of this transformation. It closes the loop from measurement to matching to press-fitting to testing. It reduces cycle time by twelve minutes per wheel set. It improves consistency, traceability, and safety. It joins an existing family of industrial robots that support motor and brake maintenance. Together, they point toward a future in which urban rail maintenance is increasingly digital, automated, and intelligent.
For me, the most meaningful outcome is confidence. When I see a wheel set released from this line, I know that its critical dimensions were measured, its fit was controlled, its press force was recorded, its tightening was verified, and its running-in behavior was tested. I know that the data is stored and can be retrieved. I know that the process was not dependent on a single operator’s judgment at a single moment. That confidence is what smart maintenance ultimately provides. It is the confidence that the work has been done correctly, consistently, and safely, not just once, but every time.
Industrial robots will continue to evolve. Sensors will become more capable. AI models will become more accurate. Communication networks will become faster. Digital twins will become more detailed. But the fundamental principle will remain the same: use intelligent machines to extend human capability, not to replace human responsibility. In the wheel-axle maintenance line, I see that principle in action. I see measurement, motion, force, data, and human oversight working together. I see a maintenance process that is no longer only manual, and not yet fully autonomous, but genuinely intelligent. That is the direction I want to continue following, and it is the reason I believe industrial robots will play an even larger role in rail transit maintenance in the years ahead.