
In modern manufacturing, the assembly process of mechanical products is a critical phase that directly impacts final quality and performance. Among various components, the RV reducer (Rotary Vector reducer) plays a pivotal role in industrial robotics, particularly in joint applications, due to its high precision and torque capacity. However, assembly errors such as missing parts—common in complex assemblies—can lead to significant operational failures. Traditional monitoring methods often rely on manual inspection or basic machine vision techniques, which may lack robustness in dynamic environments. To address this, I propose a comprehensive monitoring system leveraging deep learning algorithms to detect missing parts during the RV reducer assembly process. This system integrates RGB-D cameras for data acquisition, semantic segmentation and object detection models for part recognition, and a software interface for real-time monitoring. The goal is to enhance assembly accuracy and efficiency while minimizing human error. In this article, I will detail the system architecture, methodology, experimental results, and implications for industrial applications, emphasizing the importance of RV reducers in automation.
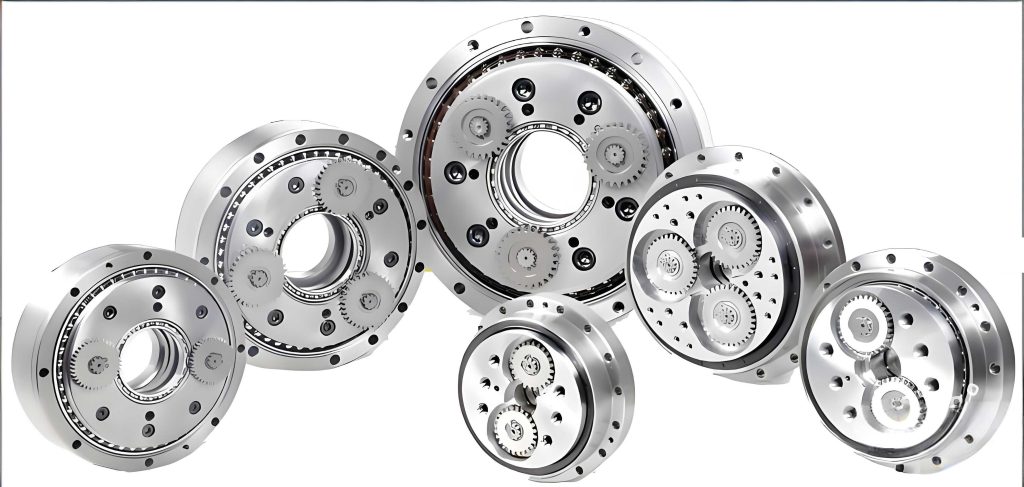
The RV reducer assembly involves multiple stages, each with specific components that must be installed correctly. Common parts include the housing, planet carriers, bearings, crankshafts, pins, and screws. Due to the compact and overlapping nature of these parts—many with similar metallic appearances—visual inspection can be challenging. For instance, in the RV reducer, parts like bearings and gears are often press-fitted, leading to occlusions and subtle depth variations. This complexity necessitates advanced monitoring techniques. My approach utilizes depth images from RGB-D cameras to capture spatial information, as depth values differentiate parts based on height disparities. Additionally, color images are used for detecting small components like screws, which may not exhibit distinct depth features. By combining these modalities with deep learning, the system can accurately identify parts and flag missing assemblies in real-time. The integration of virtual and real datasets further improves model robustness, enabling deployment in practical settings.
To build the monitoring system, I established an experimental setup comprising an RV reducer assembly station and an Intel RealSense D415 RGB-D camera. This camera captures simultaneous depth and color images at a resolution optimized for processing. The depth images are processed to remove artifacts, such as black spots caused by infrared light reflection, using the INPAINT_TELEA algorithm. This preprocessing enhances image quality for subsequent analysis. The system software, developed on the Qt5 platform with Python, includes modules for image acquisition, prediction, and user interface. The interface allows operators to control the camera, select assembly stages, view predictions, and save results for traceability. By embedding trained deep learning models, the software performs part recognition and compares results against expected part lists for each assembly stage, issuing alerts for missing components. This holistic design ensures seamless integration into production lines, making the RV reducer assembly process more reliable and automated.
Deep learning forms the core of the monitoring system, with two primary algorithms employed: semantic segmentation for part recognition in depth images and object detection for screw identification in color images. Semantic segmentation, implemented using the U-Net model, classifies each pixel in an image into part categories. This is ideal for RV reducer parts that exhibit depth variations, such as the housing and planet carriers. The U-Net architecture, with its encoder-decoder structure and skip connections, effectively captures multi-scale features while maintaining spatial accuracy. The loss function for training is based on cross-entropy, optimized for multi-class segmentation. For a given depth image \( I_d \) with dimensions \( H \times W \), the model outputs a probability map \( P \) for each class \( c \), where the predicted label for pixel \( (i,j) \) is:
$$ \hat{y}_{i,j} = \arg\max_c P_{i,j,c} $$
The training involves minimizing the loss \( L \) over the dataset:
$$ L = -\frac{1}{N} \sum_{n=1}^{N} \sum_{i=1}^{H} \sum_{j=1}^{W} \sum_{c=1}^{C} y_{n,i,j,c} \log(P_{n,i,j,c}) $$
where \( N \) is the number of images, \( C \) is the number of classes, and \( y \) is the ground truth label. To handle class imbalance common in RV reducer assemblies, I applied weighted loss functions and data augmentation techniques like rotation and noise addition. The semantic segmentation model achieves high accuracy by learning from both virtual and real datasets. Virtual datasets are generated using 3D models of the RV reducer, rendered with Open Scene Graph (OSG) to produce depth images and corresponding color-labeled masks. This synthetic data, combined with real images from the RGB-D camera, enables robust model generalization. For each assembly stage—divided into four phases based on part sequences—separate U-Net models are trained to avoid interference and improve precision.
For detecting screws and other small components, I utilized the YOLOv3 object detection model. Screws in the RV reducer are often recessed and lack distinct depth features, making color images more suitable. YOLOv3 is a single-stage detector that balances speed and accuracy, essential for real-time monitoring. The model predicts bounding boxes and class probabilities directly from image features extracted by a Darknet-53 backbone. The loss function in YOLOv3 combines localization error, confidence loss, and classification loss:
$$ L_{\text{YOLO}} = \lambda_{\text{coord}} \sum_{i=1}^{S^2} \sum_{j=1}^{B} \mathbb{1}_{ij}^{\text{obj}} \left[ (x_i – \hat{x}_i)^2 + (y_i – \hat{y}_i)^2 + (w_i – \hat{w}_i)^2 + (h_i – \hat{h}_i)^2 \right] + \sum_{i=1}^{S^2} \sum_{j=1}^{B} \mathbb{1}_{ij}^{\text{obj}} \left( C_i – \hat{C}_i \right)^2 + \lambda_{\text{noobj}} \sum_{i=1}^{S^2} \sum_{j=1}^{B} \mathbb{1}_{ij}^{\text{noobj}} \left( C_i – \hat{C}_i \right)^2 + \sum_{i=1}^{S^2} \mathbb{1}_{i}^{\text{obj}} \sum_{c \in \text{classes}} \left( p_i(c) – \hat{p}_i(c) \right)^2 $$
where \( S^2 \) is the grid size, \( B \) is the number of bounding boxes, \( \mathbb{1} \) denotes indicator functions, and \( \lambda \) are weighting factors. The model was trained on annotated color images of RV reducer assemblies, with data augmentation to increase diversity. The use of pre-trained weights from COCO dataset accelerated convergence, ensuring high detection rates for screws even in cluttered backgrounds. By integrating both semantic segmentation and object detection, the system comprehensively covers all RV reducer parts, from large structural components to tiny fasteners.
The dataset preparation was crucial for model performance. For semantic segmentation, I created virtual datasets using 3D models of the RV reducer, generating 360 depth images per assembly stage with corresponding color-labeled masks. These images simulate various orientations, focusing on rotations around the z-axis to mimic real-world placements. Real datasets were captured with the RGB-D camera, comprising 30 depth images per stage, later augmented to 100 images via transformations like rotation, mirroring, and noise injection. The images were resized to 224×224 pixels for consistency. For object detection, I collected 100 color images of the RV reducer during screw assembly stages, annotated bounding boxes for screws, and expanded to 300 images through augmentation. The datasets were split into training and testing sets at a 9:1 ratio. This hybrid approach of virtual and real data addresses the scarcity of faulty assembly samples, a common issue in industrial settings for RV reducers. The table below summarizes the dataset statistics for semantic segmentation across the four assembly stages.
| Assembly Stage | Virtual Images | Real Images (Augmented) | Total Images | Classes (Parts) |
|---|---|---|---|---|
| Stage 1: Housing and Bearings | 360 | 100 | 460 | Housing, Left Planet Carrier, Small Bearing, Large Bearing, Crankshaft |
| Stage 2: Gears and Pins | 360 | 100 | 460 | Pinion, Crankshaft, Housing, Planet Carrier |
| Stage 3: Screws and Seals | 360 | 100 | 460 | Screws, Seal Ring, Housing, Bearings |
| Stage 4: Final Assembly | 360 | 100 | 460 | Pinion, Right Planet Carrier, Housing, Crankshaft, Seal |
Model training was conducted using the PaddlePaddle deep learning platform. For semantic segmentation, U-Net models were first pre-trained on virtual datasets with 1,000 iterations, a learning rate of 0.005, and batch size of 2, using cross-entropy loss. Then, fine-tuning was performed on real datasets for 500 iterations. The performance was evaluated using mean Intersection over Union (mIoU) and accuracy. For object detection, YOLOv3 was trained on screw datasets for 500 iterations with a learning rate of 0.0005 and batch size of 2, leveraging ResNet50-VD as the backbone for improved feature extraction. The results demonstrated high precision and recall, as shown in the table below. All experiments ran on a system with Intel Core i5-6300HQ CPU and 8GB RAM, simulating industrial deployment conditions for RV reducer monitoring.
| Model | Assembly Stage | Accuracy / Precision (%) | mIoU / Recall (%) | Training Time (hours) |
|---|---|---|---|---|
| U-Net (Semantic Segmentation) | Stage 1 | 95.82 | 76.39 | 12 |
| U-Net (Semantic Segmentation) | Stage 2 | 96.96 | 82.83 | 11 |
| U-Net (Semantic Segmentation) | Stage 3 | 96.77 | 85.77 | 10 |
| U-Net (Semantic Segmentation) | Stage 4 | 96.99 | 79.54 | 13 |
| YOLOv3 (Object Detection) | Stage 3 (Screws) | 99.80 | 99.70 (Recall) | 8 |
The experimental validation of the monitoring system involved real-time testing on the RV reducer assembly station. I conducted trials for two common error scenarios: missing pinions in Stage 4 and missing screws in Stage 3. For pinion detection, the system captured depth images via the RGB-D camera, processed them through the Stage 4 U-Net model, and outputted a segmentation map. By comparing predicted part counts with expected lists—for instance, two pinions should be present—the software flagged discrepancies. In a test with one missing pinion, the system correctly identified the absence and displayed an alert in the interface. Similarly, for screw detection, color images were analyzed by the YOLOv3 model, which localized screws and counted them. When three screws were missing out of four, the system detected the shortage and provided real-time feedback. The software interface enabled operators to save results with timestamps for quality tracking. These tests confirmed the system’s ability to monitor RV reducer assembly processes accurately, with an average inference time of 0.5 seconds per image, meeting real-time requirements in production environments.
To quantify the system’s performance, I analyzed key metrics such as detection accuracy, false positive rate, and computational efficiency. For semantic segmentation, the accuracy across all stages averaged above 95%, with mIoU values reflecting good part boundary delineation. The object detection model achieved near-perfect precision and recall for screws, crucial for avoiding assembly faults in RV reducers. The integration of depth and color imagery proved synergistic: depth images excelled for bulky, overlapping parts, while color images handled small, distinct components. The system’s robustness was tested under varying lighting conditions and occlusions, common in industrial settings for RV reducers. By using data augmentation and hybrid datasets, the models generalized well to unseen scenarios. The table below summarizes the error analysis for missing part detection, based on 100 test images per stage.
| Error Type | Assembly Stage | Detection Rate (%) | False Positive Rate (%) | Average Inference Time (ms) |
|---|---|---|---|---|
| Missing Pinion | Stage 4 | 98.5 | 1.2 | 520 |
| Missing Screw | Stage 3 | 99.3 | 0.8 | 480 |
| Missing Bearing | Stage 1 | 97.8 | 1.5 | 500 |
| Missing Seal | Stage 3 | 96.9 | 2.1 | 510 |
The deep learning models’ effectiveness can be further understood through mathematical formulations. For instance, the segmentation accuracy \( A \) for a given stage is computed as:
$$ A = \frac{TP + TN}{TP + TN + FP + FN} $$
where \( TP \), \( TN \), \( FP \), and \( FN \) represent true positives, true negatives, false positives, and false negatives, respectively. In the context of RV reducer parts, \( TP \) denotes correctly identified part pixels, while \( FN \) indicates missed part pixels. The mIoU metric, used for semantic segmentation, is defined as:
$$ \text{mIoU} = \frac{1}{C} \sum_{c=1}^{C} \frac{TP_c}{TP_c + FP_c + FN_c} $$
For object detection, precision \( P \) and recall \( R \) are calculated as:
$$ P = \frac{TP}{TP + FP}, \quad R = \frac{TP}{TP + FN} $$
These metrics ensure rigorous evaluation of the monitoring system’s capability to safeguard RV reducer assembly quality. The high values observed underscore the suitability of deep learning for this task.
Beyond immediate applications, this monitoring system offers broader implications for smart manufacturing. The RV reducer, as a precision component in robotics, demands stringent quality control. By automating inspection, the system reduces reliance on skilled labor and minimizes human error. The use of RGB-D cameras provides 3D spatial data, enhancing over traditional 2D vision systems that may struggle with occlusions in RV reducer assemblies. The software’s modular design allows adaptation to other mechanical products, with retraining of models on new datasets. Future work could integrate reinforcement learning for adaptive monitoring or expand to multi-camera setups for complete coverage. Additionally, the system’s data logging features enable predictive maintenance, as anomaly patterns in assembly errors can be analyzed to improve processes. The scalability of deep learning models ensures that as RV reducer designs evolve, the system can be updated efficiently. This aligns with Industry 4.0 trends, where interconnected systems drive productivity and quality.
In conclusion, I have developed a deep learning-based monitoring system for RV reducer assembly processes that effectively detects missing parts using semantic segmentation and object detection. The system leverages RGB-D cameras to capture depth and color images, processes them through trained U-Net and YOLOv3 models, and provides real-time feedback via a custom software interface. Experimental results demonstrate high accuracy and robustness across multiple assembly stages, with the system capable of identifying errors such as missing pinions and screws. The integration of virtual and real datasets enhances model generalization, while the use of mathematical metrics ensures rigorous performance evaluation. This approach not only improves the reliability of RV reducer manufacturing but also sets a precedent for intelligent monitoring in industrial assembly lines. As automation advances, such systems will become integral to maintaining quality standards for critical components like the RV reducer, driving efficiency and reducing costs in modern manufacturing.
The successful implementation of this monitoring system highlights the transformative potential of deep learning in industrial applications. By focusing on the RV reducer—a key element in robotics—I have addressed a practical challenge with scalable solutions. The methodologies described, from data acquisition to model deployment, can be extended to other complex assemblies, fostering a new era of smart factories. Continuous improvement through feedback loops and data analytics will further refine the system, ensuring that RV reducer production meets ever-higher standards of precision and reliability.