
In the context of global industrial advancements such as Germany’s “Industry 4.0” and China’s “Made in China 2025” strategy, smart manufacturing and intelligent robotics have become pivotal. The performance and precision of industrial robots heavily depend on the accuracy and reliability of their joint actuators, particularly the RV reducer. As a critical component in robotic systems, the RV reducer ensures smooth motion transmission and high positioning accuracy. However, evaluating the key performance parameters of RV reducers, such as backlash, torsional stiffness, and angle transmission error, poses significant challenges due to the limitations of existing test platforms. Traditional test setups often suffer from low accuracy, limited applicability to different RV reducer models, and high testing costs. To address these issues, I have designed and developed a novel test platform specifically for RV reducers used in robots. This platform aims to enhance testing efficiency, reduce costs, and provide comprehensive assessments of multiple performance indicators. In this article, I will detail the design principles, theoretical analysis, and experimental validation of this test platform, emphasizing its capability to handle various RV reducer models and deliver precise measurements.
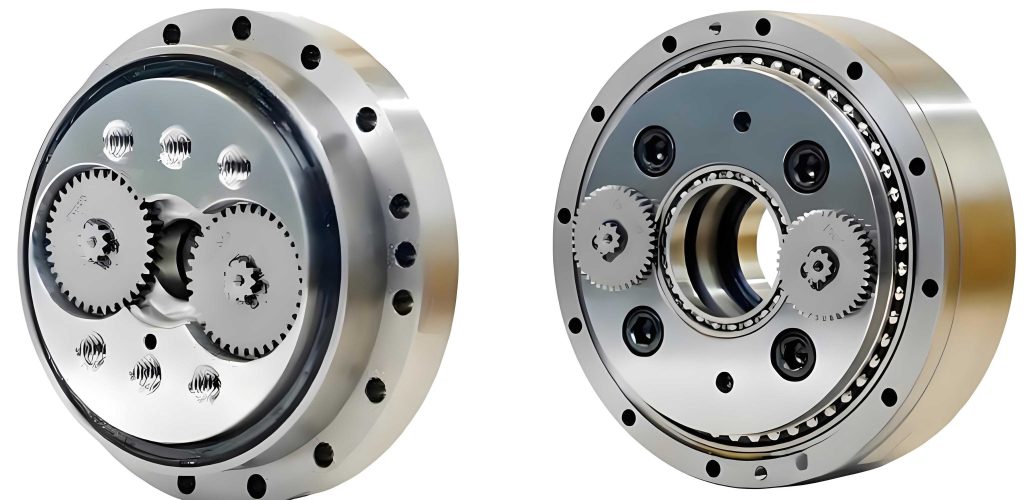
The RV reducer, as shown in the image above, is a precision gear mechanism that combines cycloidal and planetary gear trains to achieve high reduction ratios and compact design. Its performance directly influences the operational accuracy of robotic joints, making rigorous testing essential. Key performance metrics for RV reducers include backlash, torsional stiffness, lost motion, and angle transmission error. Backlash refers to the angular displacement difference at the output end when the RV reducer is subjected to clockwise and counterclockwise torques, typically at 3% of the rated torque, with the input and housing fixed. This parameter is crucial for assessing the play or间隙 in the gear system, which can affect positioning repeatability. In hysteresis curves, backlash is visually represented as the gap between loading and unloading paths. Torsional stiffness, on the other hand, measures the RV reducer’s resistance to deformation under torque loads. It is defined as the ratio of applied torque to the resulting elastic angular deformation at the output end, with the input fixed. Lost motion, often derived from hysteresis curves, represents the angular play during torque reversal at zero load, indicating gear mesh间隙 effects. Angle transmission error captures the deviation between theoretical and actual output angles for any given input rotation, reflecting the RV reducer’s dynamic accuracy during operation. These parameters collectively determine the overall performance of RV reducers in robotic applications, and accurate measurement is vital for quality control and optimization.
To analyze these performance indicators, we can represent the hysteresis curve of an RV reducer mathematically. For instance, the torsional stiffness \( k \) can be derived from torque \( T \) and angular displacement \( \theta \) data. The hysteresis loop typically shows nonlinear behavior, but for small deformations, we can approximate it linearly. The backlash \( B \) is calculated as the angular difference at zero torque between forward and reverse loading paths, while lost motion \( L \) is the angular shift during torque reversal. In terms of angle transmission error \( \Delta \theta \), it is expressed as \( \Delta \theta = \theta_{\text{actual}} – \theta_{\text{theoretical}} \), where \( \theta_{\text{theoretical}} = \frac{\theta_{\text{input}}}{i} \) and \( i \) is the reduction ratio of the RV reducer. Ensuring precise measurement of these parameters requires a robust test platform with high-resolution sensors and controlled loading mechanisms.
The design of the new test platform for RV reducers incorporates several innovative features to overcome the limitations of existing systems. The platform consists of three main subsystems: a servo-driven system for input motion, a mechanical transmission system for mounting and loading the RV reducer, and a control and data acquisition system for real-time monitoring and analysis. The servo-driven system includes a servo motor mounted on a precision movable slide table, allowing quick adaptation to different RV reducer models. The mechanical transmission system features an input gear shaft, an RV reducer mounting flange, an output shaft, and a pneumatic disc brake for loading. This configuration enables both static and dynamic loading, enhancing testing versatility. The control and data acquisition system utilizes a PLC controller, high-precision angle encoders, torque sensors, and data acquisition cards to collect and process signals, with results displayed on an HMI touchscreen and exported to Excel for further analysis.
In terms of structural design, the test platform emphasizes modularity and flexibility. The movable slide table facilitates rapid replacement of RV reducers by simply sliding out the input assembly, swapping the RV reducer and associated flanges, and repositioning the slide. This design significantly reduces downtime and expands the platform’s applicability to various RV reducer models. The loading mechanism employs a pneumatic disc brake, which offers continuous and adjustable torque application, unlike traditional methods like magnetic powder clutches or manual weight loading. This improvement allows for more accurate simulation of real-world operating conditions and enhances testing efficiency. The overall architecture ensures that the test platform can handle RV reducers with different sizes and specifications, making it a cost-effective solution for manufacturers and researchers.
System accuracy is paramount in testing RV reducers, given their high precision requirements. The test platform integrates high-resolution sensors to minimize measurement errors. For angular displacement, I use HEIDENHAIN RON886 and RON785 angle encoders at the output and input ends, respectively, with accuracies of 1 arcsecond and 2 arcseconds. These encoders provide precise measurements of twist angles, essential for calculating torsional stiffness and backlash. For torque measurement, a dual-range torque sensor (0–100 N·m and 0–1000 N·m) with an accuracy of 0.15% F.S. is employed, catering to different RV reducer capacities. However, the measured stiffness \( k_c \) includes contributions from other components, such as the input shaft stiffness \( k_{in} \), output shaft stiffness \( k_{out} \), and support stiffness. To isolate the actual torsional stiffness \( k \) of the RV reducer, we must account for these factors. The equivalent stiffness model treats these components as in series, with the support stiffnesses negligible due to rigid mounting. The relationship is given by:
$$ \frac{1}{k} = \frac{1}{k_c} – \frac{1}{k_{in} i^2} – \frac{1}{k_{out}} $$
Here, \( i \) is the reduction ratio of the RV reducer. The tested stiffness \( k_c \) is obtained from experimental data via linear regression, while \( k_{in} \) and \( k_{out} \) are calculated based on material properties and geometries. This correction ensures that the derived stiffness accurately reflects the RV reducer’s intrinsic performance. For instance, if an RV reducer has a high reduction ratio, the input shaft stiffness term becomes less significant due to the \( i^2 \) factor, but it must still be considered for precision. This analytical approach enhances the reliability of test results, making the platform suitable for benchmarking RV reducers against industry standards.
The control and data acquisition system is built around a Siemens S7-200 PLC, which communicates with the servo drive via bus protocols and interfaces with sensors through hardwired connections and high-speed counters. The angle encoders output signals converted to differential formats for accurate counting, while the torque sensor provides analog voltage signals. Data are processed in real-time, with hysteresis curves and stiffness plots generated automatically. The HMI touchscreen allows operators to set parameters such as load cycles, torque limits, and test modes, streamlining the testing process. This integrated system not only improves accuracy but also reduces human error, ensuring consistent and repeatable tests for RV reducers.
To validate the effectiveness of the test platform, I conducted comparative experiments on an imported RV reducer and a domestic RV reducer of similar specifications. The tests focused on torsional stiffness, lost motion, backlash, and angle transmission error. For torsional stiffness assessment, each RV reducer was subjected to forward and reverse loading up to the rated torque, with torque and angle data recorded. The hysteresis curves were plotted, and stiffness values were calculated using the least squares method. The table below summarizes the raw test data for the imported RV reducer, showcasing torque and angular displacement during loading and unloading cycles.
| Sequence | Forward Load Torque (N·m) | Forward Load Angle (arcmin) | Forward Unload Torque (N·m) | Forward Unload Angle (arcmin) | Reverse Load Torque (N·m) | Reverse Load Angle (arcmin) | Reverse Unload Torque (N·m) | Reverse Unload Angle (arcmin) |
|---|---|---|---|---|---|---|---|---|
| 1 | 0.000 | 0.000 | 154.840 | 3.165 | 0.000 | 0.327 | -154.840 | -3.056 |
| 2 | 15.484 | 0.346 | 139.356 | 2.947 | -15.484 | -0.219 | -139.356 | -2.838 |
| 3 | 30.968 | 0.882 | 123.872 | 2.783 | -30.968 | -0.764 | -123.872 | -2.619 |
| 4 | 46.452 | 1.210 | 108.388 | 2.456 | -46.452 | -1.092 | -108.388 | -2.292 |
| 5 | 61.936 | 1.528 | 92.904 | 2.270 | -61.936 | -1.419 | -92.904 | -2.074 |
| 6 | 77.420 | 1.855 | 77.420 | 1.954 | -77.420 | -1.747 | -77.420 | -1.855 |
| 7 | 92.904 | 2.183 | 61.936 | 1.637 | -92.904 | -2.074 | -61.936 | -1.528 |
| 8 | 108.388 | 2.401 | 46.452 | 1.419 | -108.388 | -2.292 | -46.452 | -1.201 |
| 9 | 123.872 | 2.728 | 30.968 | 1.201 | -123.872 | -2.620 | -30.968 | -0.873 |
| 10 | 139.356 | 2.947 | 15.484 | 0.764 | -139.356 | -2.838 | -15.484 | -0.437 |
| 11 | 154.840 | 3.165 | 0.000 | 0.327 | -154.840 | -3.056 | 0.000 | -0.109 |
Similarly, data for the domestic RV reducer were collected and tabulated. From these datasets, hysteresis curves were generated, and key parameters were extracted. The actual torsional stiffness \( k \) was computed using the correction formula mentioned earlier. For the imported RV reducer, the tested stiffness \( k_c \) was approximately 58.5 N·m/arcmin, and after accounting for input and output shaft stiffnesses (with \( k_{in} = 1200 \, \text{N·m/arcmin} \), \( k_{out} = 800 \, \text{N·m/arcmin} \), and \( i = 100 \)), the actual stiffness \( k \) was derived as 56.062 N·m/arcmin. For the domestic RV reducer, the values were \( k_c = 42.5 \, \text{N·m/arcmin} \) and \( k = 40.351 \, \text{N·m/arcmin} \). The comparison reveals that the domestic RV reducer has 28% lower torsional stiffness than the imported one, indicating inferior load-bearing capacity and deformation resistance. This difference can impact the stability of robotic operations, especially under dynamic loads.
In addition to stiffness, backlash and lost motion are critical for assessing the precision of RV reducers. From the hysteresis curves, backlash \( B \) is calculated as the angular difference at zero torque between the forward and reverse loading paths. For the imported RV reducer, \( B = 0.21 \, \text{arcmin} \), while for the domestic one, \( B = 0.22 \, \text{arcmin} \), showing a slight 4.8% increase. Lost motion \( L \), representing the play during torque reversal, was 0.436 arcmin for the imported RV reducer and 0.546 arcmin for the domestic one, a 25.2% increase. These results suggest that the domestic RV reducer has larger gear mesh间隙, which could lead to reduced accuracy in positioning applications. The table below summarizes the performance characteristics of both RV reducers, highlighting the disparities.
| RV Reducer Type | Torsional Stiffness (N·m/arcmin) | Lost Motion (arcmin) | Backlash (arcmin) |
|---|---|---|---|
| Imported RV Reducer | 56.062 | 0.436 | 0.21 |
| Domestic RV Reducer | 40.351 | 0.546 | 0.22 |
| Percentage Difference | -28% | +25.2% | +4.8% |
The angle transmission error test involved rotating the input shaft through multiple cycles and measuring the output angle deviation. The imported RV reducer exhibited a smooth error curve with minimal fluctuations, while the domestic RV reducer showed larger variations. The maximum and minimum angle differences were recorded, and the overall angle transmission error \( \Delta \theta_{\text{total}} \) was computed as the range of deviations. For the imported RV reducer, \( \Delta \theta_{\text{total}} = 2.01 \, \text{arcmin} \), with a mean error of 0.018 arcmin and a standard deviation of 0.547 arcmin. For the domestic RV reducer, \( \Delta \theta_{\text{total}} = 2.51 \, \text{arcmin} \), mean error of -0.441 arcmin, and standard deviation of 0.705 arcmin. This indicates that the domestic RV reducer has 24.9% higher angle transmission error and 28.9% greater variability, which could adversely affect repeatability in robotic tasks. The error curves can be modeled using Fourier series to analyze harmonic components, but for brevity, the summary statistics suffice to demonstrate the performance gap.
The experimental validation confirms that the test platform effectively measures key parameters of RV reducers with high accuracy. The results align with theoretical expectations, as the stiffness values corrected for system components match typical specifications for RV reducers. Moreover, the platform’s ability to handle different models was demonstrated through quick changeovers during tests, reducing setup time from hours to minutes. This flexibility is crucial for manufacturers seeking to benchmark various RV reducer designs or for quality assurance in production lines. The use of high-precision sensors and robust data processing ensures that measurements are reliable, enabling detailed comparisons like those between imported and domestic RV reducers. Such insights are valuable for guiding improvements in domestic RV reducer manufacturing, as the data highlight specific areas for enhancement, such as gear machining and assembly tolerances.
In conclusion, the new test platform for RV reducers represents a significant advancement in precision measurement technology for robotic components. Its design incorporates modularity, high-resolution sensing, and automated control, allowing for efficient and accurate testing of multiple performance indicators across different RV reducer models. The comparative experiments revealed that domestic RV reducers lag behind imported ones in torsional stiffness, lost motion, and angle transmission error, underscoring the need for further development in domestic manufacturing. The test platform’s results are consistent with theoretical models, validating its methodology and making it a reliable tool for researchers and engineers. Future work could involve extending the platform to test other types of precision reducers, such as harmonic drives, or integrating artificial intelligence for predictive maintenance analysis. By providing a cost-effective and versatile solution, this test platform contributes to the advancement of robotic technology and supports the global push toward smarter industrialization.