
In my work, I address a central difficulty in the modeling and control of industrial robots: a purely physics-based dynamic model can explain the dominant inertial, Coriolis, centrifugal, and gravitational effects, but it often fails to describe friction nonlinearity, transmission compliance, actuator hysteresis, and cross-joint coupling with sufficient accuracy. For industrial robots performing fine assembly, collision detection, and human–robot collaboration, torque prediction quality directly affects feedforward control, force estimation, state monitoring, and trajectory tracking. I therefore develop a hybrid dynamics modeling framework that keeps the interpretability of a physically parameterized model while adding a data-driven residual compensation model based on a spatiotemporal graph neural network with a Kolmogorov–Arnold Network regression head. In the following sections, I describe the baseline model, the excitation trajectory design, the physically feasible identification procedure, the spatiotemporal residual learning architecture, and the experimental validation on a six-degree-of-freedom serial industrial robot.
1. Baseline Dynamics Modeling for Industrial Robots
For serial industrial robots, the rigid-body dynamics can be written using the Newton–Euler or Lagrangian formulation. I use the following standard inverse dynamics form:
$$
\tau = M(q)\ddot{q} + C(q,\dot{q})\dot{q} + G(q) + \tau_f .
$$
Here, \(q \in \mathbb{R}^n\), \(\dot{q} \in \mathbb{R}^n\), and \(\ddot{q} \in \mathbb{R}^n\) denote joint position, velocity, and acceleration, respectively. \(M(q) \in \mathbb{R}^{n \times n}\) is the inertia matrix, \(C(q,\dot{q}) \in \mathbb{R}^{n \times n}\) contains Coriolis and centrifugal terms, \(G(q) \in \mathbb{R}^n\) is the gravity vector, \(\tau \in \mathbb{R}^n\) is the joint driving torque, and \(\tau_f \in \mathbb{R}^n\) is the joint friction torque. The number of joints is \(n\), and for the experimental platform considered here \(n=6\).
For friction, I adopt a Coulomb–viscous model:
$$
\tau_f = F_c \operatorname{sgn}(\dot{q}) + F_v \dot{q},
$$
where \(F_c\) is the Coulomb friction coefficient, \(F_v\) is the viscous friction coefficient, and \(\operatorname{sgn}(\dot{q})\) is the sign function of joint velocity. This model is simple and physically meaningful, but it cannot represent Stribeck effects, presliding displacement, or direction-dependent hysteresis. Such unmodeled effects become important in industrial robots that operate over a wide range of speeds and payloads.
Because the rigid-body dynamics are linear in the inertial parameters, I can express the torque as a linear regression:
$$
\tau = Y(q,\dot{q},\ddot{q}) P,
$$
where \(Y(q,\dot{q},\ddot{q}) \in \mathbb{R}^{n \times s}\) is the regressor matrix, \(P \in \mathbb{R}^{s}\) is the standard dynamic parameter vector, and \(s\) is the total number of parameters. The standard parameters are not all independent because of structural coupling and linear dependence. Therefore, I use inertial parameter regrouping to obtain a full-column-rank regressor and a base parameter vector:
$$
\tau = \bar{Y}(q,\dot{q},\ddot{q}) P_b .
$$
This base parameter representation is the foundation of the baseline physical model. It provides a compact, interpretable description of the dominant dynamics of industrial robots. However, it still leaves a residual that contains friction, flexibility, hysteresis, and joint coupling effects that are not captured by the rigid-body assumption.
2. Excitation Trajectory Design and Optimization
To identify the dynamic parameters accurately, the robot must be excited by a trajectory that covers the relevant joint space while respecting physical limits. I use a finite Fourier series for each joint:
$$
q_i(t) = q_{i0} + \sum_{l=1}^{N} \frac{a_{l,i}}{l\omega_f} \sin(l\omega_f t) – \frac{b_{l,i}}{l\omega_f} \cos(l\omega_f t),
$$
where \(N\) is the order of the Fourier series, \(\omega_f\) is the fundamental frequency, \(q_{i0}\) is the initial offset of joint \(i\), and \(a_{l,i}\) and \(b_{l,i}\) are Fourier coefficients to be optimized. This periodic representation is smooth and differentiable, so joint velocity and acceleration can be obtained analytically. It also allows the trajectory to be repeated and averaged, which reduces the influence of measurement noise.
I optimize the Fourier coefficients by minimizing the condition number of the regressor matrix:
$$
\min_{a,b} \operatorname{cond}(Y).
$$
The optimization is subject to joint position, velocity, and acceleration limits, as well as smooth start and stop conditions:
$$
|q_i(t)| \le q_{i,\max}, \quad |\dot{q}_i(t)| \le v_{i,\max}, \quad |\ddot{q}_i(t)| \le a_{i,\max},
$$
$$
q_i(t_0) = q_i(t_f), \quad \dot{q}_i(t_0) = \dot{q}_i(t_f) = 0, \quad \ddot{q}_i(t_0) = \ddot{q}_i(t_f) = 0.
$$
In my implementation, I solve this constrained optimization offline. The resulting excitation trajectory is used for parameter identification and for constructing the baseline physical model. A well-conditioned regressor improves numerical stability and reduces sensitivity to noise, which is essential for industrial robots that must operate reliably in production environments.
Table 1 summarizes the optimized excitation trajectory parameters used in my experiments.
| Parameter | Value |
|---|---|
| Fourier series order \(N\) | 5 |
| Fundamental frequency \(\omega_f\) | Selected to satisfy joint velocity limits |
| Trajectory duration | 20 s |
| Sampling frequency | 100 Hz |
| Optimization solver | Constrained nonlinear programming |
3. Physically Feasible Parameter Identification
For industrial robots, parameter identification should not only minimize torque prediction error but also ensure physical consistency. A set of parameters that fits the data well but violates mass and inertia feasibility can produce unstable or nonphysical predictions. I therefore formulate identification as a constrained convex optimization problem.
For link \(k\), the mass must satisfy \(m_k > 0\). The link inertia tensor must be positive definite. Using the parallel axis theorem, the link-frame inertia tensor \(L_k\) and the center-of-mass inertia tensor \(I_k\) are related by
$$
I_k = L_k – \frac{1}{m_k} S(l_k) S(l_k)^T,
$$
where \(l_k\) is the first moment of inertia and \(S(\cdot)\) is the skew-symmetric operator. This nonlinear constraint can be transformed into a linear matrix inequality on the standard parameter vector of link \(k\):
$$
D_i = \begin{bmatrix} I_i & S(p_i) \\ S(p_i)^T & m_i I \end{bmatrix} \succ 0.
$$
I then solve the following constrained optimization problem:
$$
\min_{\theta} \| Y \theta – \tau_{\mathrm{vec}} \|_2^2
$$
$$
\mathrm{s.t.} \quad D_i(\theta) \succ 0, \quad f_i \ge 0,
$$
where \(\tau_{\mathrm{vec}}\) is the stacked measured torque vector over all sampling instants, and \(f_i\) represents friction parameters. I build the semidefinite programming model and solve it with a suitable convex solver. This yields parameters that satisfy both fitting accuracy and physical feasibility. The resulting baseline model is used to predict torque, and the prediction error is treated as the residual for the data-driven compensation stage.
4. Spatiotemporal Graph Neural Network Residual Compensation
Even with a physically feasible baseline, the model residual is not random. In industrial robots, the residual contains structured temporal dependence and cross-joint coupling. I therefore design a residual compensation model that learns both spatial and temporal dependencies. The overall architecture is called STG-KAN, which stands for spatiotemporal graph neural network with a Kolmogorov–Arnold Network regression head.
4.1 Residual Definition and Input Representation
For each time instant \(t\), I define the residual as
$$
r(t) = \tau_{\mathrm{actual}}(t) – \tau_{\mathrm{pred}}(t),
$$
where \(\tau_{\mathrm{actual}}(t)\) is the measured joint torque and \(\tau_{\mathrm{pred}}(t)\) is the baseline physical model prediction. For joint \(i\), I construct a node feature vector:
$$
z_i(t) = [q_i(t), \dot{q}_i(t), \ddot{q}_i(t), \operatorname{sgn}(\dot{q}_i(t))]^T.
$$
The first three terms describe the joint motion state, and the sign term provides friction direction information. The system representation at time \(t\) is
$$
Z(t) = [z_1(t)^T, z_2(t)^T, \ldots, z_N(t)^T]^T.
$$
I use a sliding time window of length \(W=20\) and a step of one sample:
$$
X_t = [Z(t-W+1), Z(t-W+2), \ldots, Z(t)].
$$
Thus, the input contains both local joint states and historical information. After linear mapping, the input is organized as a tensor with batch, channel, joint, and time dimensions. This representation allows the network to learn joint coupling and temporal hysteresis simultaneously.
4.2 Physically Consistent Multi-Relation Graph Modeling
The dynamic propagation in serial industrial robots is asymmetric. Motion states propagate from the base to the end effector along the kinematic chain, while inertial forces and payload torques accumulate from the end effector back to the base. To describe this behavior, I model the robot as a graph whose nodes are joints and whose edges represent dynamic relations.
I construct a multi-relation graph with three main components: a downward propagation graph \(A_{\mathrm{down}}\), an upward feedback graph \(A_{\mathrm{up}}\), and a coupling graph \(A_{\mathrm{cpl}}\). For a six-joint serial robot, \(A_{\mathrm{down}}\) follows the chain \(1 \to 2 \to \cdots \to 6\), and \(A_{\mathrm{up}}\) follows the reverse direction. Both are row-normalized. The coupling graph \(A_{\mathrm{cpl}}\) establishes weighted connections among all joint pairs to represent nonlocal dynamic coupling.
Because joint torque is also affected by non-adjacent link inertia, Coriolis forces, and end-effector payload, I introduce an exponential decay prior based on joint index distance:
$$
A_{\mathrm{prior},ij} = \begin{cases} 1, & i=j, \\ \exp(-|i-j|/\sigma), & i \ne j, \end{cases}
$$
where \(\sigma > 0\) is the decay coefficient. I set \(\sigma = 1.2\). To allow the model to adapt to effects not captured by the prior, I add a learnable correction term:
$$
\Delta A = s \cdot \tanh\left( \frac{B B^T}{2} \right),
$$
where \(B\) is a learnable parameter matrix and \(s=0.3\) is an amplitude scaling coefficient. The final coupling adjacency is
$$
\hat{A}_{\mathrm{cpl}} = D^{-1/2} (A_{\mathrm{prior}} + \Delta A) D^{-1/2},
$$
where \(D\) is the corresponding degree matrix. In this way, the coupling relation is determined jointly by prior structure and learned correction.
For feature aggregation, I use a multi-relation graph convolution module. Let \(H \in \mathbb{R}^{J \times T \times C}\) be the input feature tensor, where \(J\), \(T\), and \(C\) denote the number of joints, time length, and channel dimension. The graph convolution output is
$$
G(H) = \phi_s(H) + \alpha_d \phi_d(H \hat{A}_{\mathrm{down}}) + \alpha_u \phi_u(H \hat{A}_{\mathrm{up}}) + \alpha_c \phi_c(H \hat{A}_{\mathrm{cpl}}),
$$
where \(\phi_s\), \(\phi_d\), \(\phi_u\), and \(\phi_c\) are linear mappings implemented by convolutions. The gating coefficients are
$$
\alpha_d = \sigma(g_d), \quad \alpha_u = \sigma(g_u), \quad \alpha_c = \sigma(g_c),
$$
where \(g_d\), \(g_u\), and \(g_c\) are learnable scalar parameters, and \(\sigma(\cdot)\) is the sigmoid function. This design allows the network to adaptively adjust the contribution of each propagation channel.
4.3 Multi-Scale Causal Dilated Temporal Modeling
The residual of the baseline physical model depends not only on the current joint state but also on historical motion. Friction, transmission compliance, and actuator hysteresis introduce temporal dependencies that span multiple time scales. I therefore use multi-scale causal dilated convolution to encode historical state sequences.
The basic causal dilated convolution is
$$
(T_h)(t) = \sum_{m=0}^{K-1} \Theta_m h(t – m d),
$$
where \(K\) is the kernel width, \(d\) is the dilation rate, and \(\Theta_m\) are convolution parameters. Each temporal convolution unit contains two parallel branches with kernel widths 3 and 5. In the three spatiotemporal blocks, I set \(d=1,2,4\). Each branch has 64 output channels. Left-side causal padding is used so that the output at time \(t\) depends only on current and past information.
To capture both short-term local fluctuations caused by friction reversal and long-term historical dependence caused by drive hysteresis, I use a multi-branch structure and fuse the outputs adaptively:
$$
z = \sum_{r=1}^{R} \beta_r z_r,
$$
$$
\beta_r = \frac{\exp(\gamma_r)}{\sum_{k=1}^{R} \exp(\gamma_k)},
$$
where \(\gamma_r\) are learnable branch parameters and \(\beta_r\) are normalized weights.
I also introduce a gating mechanism to enhance temporal information selection. The convolution output is decomposed into a feature channel \(z_f\) and a gate channel \(z_g\):
$$
z = \operatorname{GELU}(z_f) \odot \sigma(z_g),
$$
where \(\sigma(\cdot)\) is the sigmoid function and \(\odot\) denotes the Hadamard product. The gate modulates the feature representation and improves the ability to select relevant temporal information.
4.4 Spatiotemporal Block Integration and Attention Readout
After temporal and spatial modeling, I construct each encoding unit as a serial combination of temporal convolution, graph convolution, and temporal convolution. The first temporal convolution extracts local historical dynamics within each joint. The multi-relation graph convolution then propagates information across joints and captures directional topological coupling. The final temporal convolution integrates the fused spatiotemporal features.
Let \(H^{(l)}\) be the input of layer \(l\). The update is
$$
H^{(l+1)} = \operatorname{LN}\left( T_d^{(2)}\left( G\left( T_d^{(1)}(H^{(l)}) \right) \right) \right),
$$
where \(T_d^{(1)}(\cdot)\) and \(T_d^{(2)}(\cdot)\) are two causal dilated temporal convolutions, \(G(\cdot)\) is the multi-relation graph convolution, and \(\operatorname{LN}(\cdot)\) is layer normalization. The model first maps each joint input to 64-dimensional features through a \(1 \times 1\) convolution and then passes them through three STG blocks. This produces spatiotemporal features that combine joint topology and historical dynamics.
To extract the dynamic features most relevant to the current residual, I use a temporal attention readout. Let \(H_i \in \mathbb{R}^{C \times W}\) be the feature sequence of joint \(i\) over the window length \(W\). The attention score is
$$
s_i(t’) = \psi(H_i(:,t’)),
$$
where \(\psi(\cdot)\) is a scoring function implemented by two stacked convolutions and GELU nonlinearity. The normalized temporal weight is
$$
\alpha_i(t’) = \frac{\exp(s_i(t’))}{\sum_{\tau=t-W+1}^{t} \exp(s_i(\tau))}.
$$
The attention readout for joint \(i\) is
$$
h_i^{\mathrm{att}} = \sum_{t’=t-W+1}^{t} \alpha_i(t’) H_i(:,t’).
$$
The final temporal representation for all joints is
$$
H^{\mathrm{att}} = [h_1^{\mathrm{att}}, h_2^{\mathrm{att}}, \ldots, h_N^{\mathrm{att}}].
$$
This representation is used as the input to the KAN regression head.
4.5 KAN Regression Head for Residual Prediction
After the STG blocks and temporal attention readout, the model has obtained deep features that contain joint topological coupling and historical dynamics. To further improve the fitting capability for complex nonlinear residuals, I use a KAN structure as the regression head.
I concatenate the 64-dimensional readout features of the six joints into a 384-dimensional global feature vector and output a six-dimensional residual torque prediction:
$$
\hat{r}(t) = f_{\mathrm{reg}}\left( [h_1^{\mathrm{att}}(t), h_2^{\mathrm{att}}(t), \ldots, h_N^{\mathrm{att}}(t)] \right).
$$
For an input feature vector \(x\), a single KANLinear unit can be written as
$$
\operatorname{KAN}(x) = W_b \operatorname{SiLU}(x) + W_s \phi(x),
$$
where \(W_b\) and \(W_s\) are the weights of the base linear mapping and the spline mapping, respectively. \(\operatorname{SiLU}(\cdot)\) is the activation function, and \(\phi(x)\) is the spline basis vector obtained by expanding \(x\) with B-spline basis functions. My KAN regression head consists of three KANLinear layers. The first two layers are followed by layer normalization. The number of spline grids is 4, the B-spline order is 3, and the grid range is \([-2,2]\).
The final hybrid inverse dynamics prediction is
$$
\hat{\tau}_{\mathrm{final}}(t) = \tau_{\mathrm{pred}}(t) + \hat{r}(t),
$$
where \(\tau_{\mathrm{pred}}(t)\) is the baseline physical model prediction and \(\hat{\tau}_{\mathrm{final}}(t)\) is the compensated result. This structure preserves the physical interpretability of the baseline model while allowing the neural network to compensate for unmodeled effects.
4.6 Model Training and Evaluation
To balance robustness against local outliers and overall regression accuracy, I use a weighted Huber loss as the training objective. Let \(r(t)\) be the true residual and \(\hat{r}(t)\) the predicted residual. The loss is
$$
\mathcal{L} = \frac{1}{N} \sum_{j=1}^{N} w_j h_\delta(r_j(t) – \hat{r}_j(t)),
$$
where \(w_j\) is the loss weight for joint \(j\), and \(h_\delta(\cdot)\) is the Huber function:
$$
h_\delta(e) = \begin{cases} \frac{1}{2} e^2, & |e| \le \delta, \\ \delta(|e| – \frac{1}{2}\delta), & |e| > \delta. \end{cases}
$$
For quantitative evaluation, I use the root mean square error:
$$
\mathrm{RMSE} = \sqrt{ \frac{1}{K} \sum_{k=1}^{K} (\tau_{m,k} – \tau_{p,k})^2 },
$$
where \(\tau_{m,k}\) and \(\tau_{p,k}\) are the measured and predicted torque at sample \(k\), respectively, and \(K\) is the total number of samples. I also report the mean and standard deviation over repeated trajectory-level experiments.
5. Experimental Validation and Result Analysis
5.1 Experimental Platform and Data Description
I conducted experiments on an ER20-1780 six-degree-of-freedom serial industrial robot. The robot was controlled and monitored through a real-time automation environment. Joint position, velocity, and driving torque were recorded synchronously at 100 Hz. Position, velocity, and torque signals were filtered with an eighth-order Butterworth low-pass filter with a cutoff frequency of 3 Hz and zero-phase filtering. Joint acceleration was estimated offline by combining Kalman filtering and RTS smoothing. The processed position, velocity, acceleration, and torque were used for dynamic parameter identification and residual sample construction.
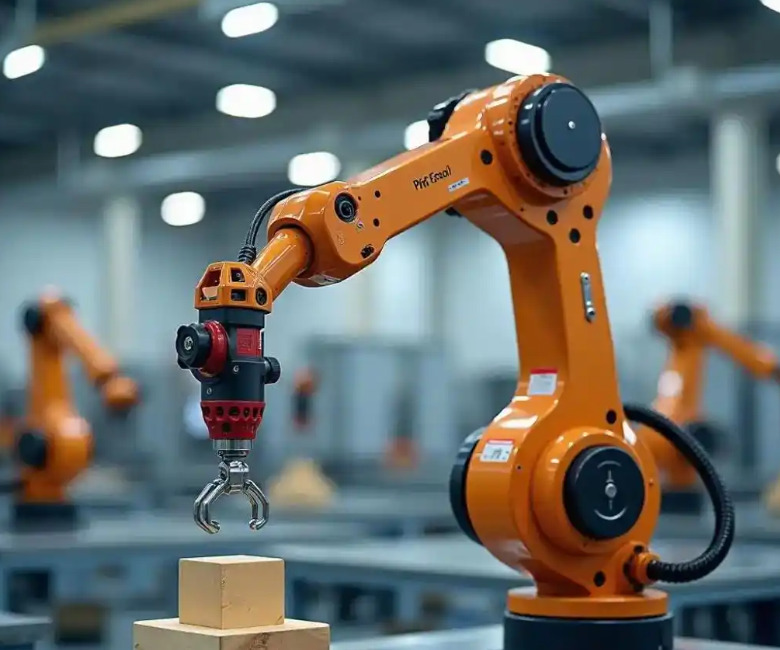
The trajectory motion range covered the workspace sufficiently. A total of 60 trajectory data sets were collected. In the baseline physical model identification stage, I used one preprocessed excitation trajectory sample to construct the observation matrix and applied the physically feasible identification method described above. Then, I used the baseline model to predict all trajectory data and constructed residual learning samples. I used complete trajectories as the minimum unit for division and split the 60 trajectories into 48 training trajectories and 12 test trajectories before constructing sliding time windows. All time windows generated from the same trajectory belonged to the same subset, which avoided data leakage caused by adjacent windows crossing the split boundary.
For the experiments, I selected representative test trajectories to show joint prediction curves. The overall performance was computed from all test trajectories in each division and reported as the mean and standard deviation of four independent experiments. To reduce the influence of random division, the random seeds were set to 1, 11, 21, and 42. All models used the same data division, preprocessing method, evaluation metric, and unified training budget. The training settings and tuning ranges are summarized in Table 2, and the number of trainable parameters of each model is given in Table 3.
| Parameter | Value | Tuning range |
|---|---|---|
| Optimizer | AdamW | Fixed |
| Initial learning rate | \(5 \times 10^{-4}\) | \(2 \times 10^{-4}\) to \(1 \times 10^{-3}\) |
| Batch size | 64 | Fixed |
| Dropout rate | 0.1 | 0 to 0.2 |
| Maximum training epochs | 60 | Fixed |
| Model | Trainable parameters (M) |
|---|---|
| BP | 0.411 |
| LSTM | 0.587 |
| GRU | 0.175 |
| STG-KAN | 1.115 |
| Case1: no graph module | 1.064 |
| Case2: no temporal module | 0.513 |
| Case3: MLP regression head | 0.711 |
Table 4 lists the improved Denavit–Hartenberg parameters of the experimental industrial robot. These parameters define the kinematic structure used for dynamic modeling and data processing.
| Joint \(i\) | \(\theta_i\) | \(\alpha_{i-1}\) (deg) | \(a_{i-1}\) (m) | \(d_i\) (m) |
|---|---|---|---|---|
| 1 | \(\theta_1\) | 180 | 0 | -0.500 |
| 2 | \(\theta_2 – 90\) | -90 | 0.200 | 0 |
| 3 | \(\theta_3\) | 0 | 0.790 | 0 |
| 4 | \(\theta_4 + 180\) | 90 | 0.140 | -0.780 |
| 5 | \(\theta_5 + 180\) | 90 | 0 | 0 |
| 6 | \(\theta_6 + 180\) | 90 | 0 | -0.124 |
5.2 Baseline Physical Model Identification and Residual Analysis
To excite the dynamic characteristics of the industrial robot, I used the periodic excitation trajectory described earlier. The trajectory used a fifth-order Fourier series and ran for 20 s. The six-joint excitation trajectory was used to collect actual motion states and driving torque data. I then applied the physically feasible identification method to estimate the dynamic parameters and establish the baseline physical model. The predicted torque from this model is denoted by \(\tau_{\mathrm{pred}}(t)\).
The baseline model was able to capture the overall torque trend, but noticeable deviations appeared in joint reversal regions, peak sections, and local fast-changing sections. These deviations are caused by friction nonlinearity, joint compliance, actuator hysteresis, and cross-joint coupling. Table 5 lists the RMSE of the baseline physical model for each joint. The first three joints had RMSE values within 15% of their maximum absolute torque, and the last three joints had RMSE values within 20% of their maximum absolute torque. This indicates that the baseline model is reasonable but leaves a structured residual that can be compensated.
| Joint \(i\) | 1 | 2 | 3 | 4 | 5 | 6 |
|---|---|---|---|---|---|---|
| RMSE (N·m) | 21.28 | 38.218 | 26.57 | 8.01 | 3.83 | 1.27 |
5.3 Prediction Performance of Hybrid Models
To verify the compensation effect on the baseline residual, I compared the baseline physical model with three typical deep learning compensation models: BP, LSTM, and GRU. The comparison used the same training budget and data split. Table 6 reports the error comparison on a representative test trajectory. On this trajectory, all hybrid models outperformed the baseline model. The proposed STG-KAN model achieved a total RMSE of 14.66 N·m, which is 44.9% lower than the baseline RMSE of 26.59 N·m. Compared with BP, LSTM, and GRU, the reductions were 24.8%, 24.2%, and 30.8%, respectively.
From the joint-level results, STG-KAN achieved the lowest RMSE on all six joints. This shows that the improvement is not limited to a single joint but is consistent across the robot. Specifically, the RMSE values of STG-KAN for joints 1 to 6 were 13.10, 30.08, 14.18, 2.46, 2.28, and 0.84 N·m, respectively, all lower than those of the comparison models.
| Joint \(i\) | Baseline | BP | LSTM | GRU | STG-KAN |
|---|---|---|---|---|---|
| 1 | 31.55 | 21.31 | 22.54 | 24.82 | 13.10 |
| 2 | 51.14 | 38.04 | 36.74 | 40.59 | 30.08 |
| 3 | 23.67 | 18.59 | 18.46 | 19.94 | 14.18 |
| 4 | 6.52 | 4.90 | 5.76 | 4.52 | 2.46 |
| 5 | 5.00 | 3.21 | 3.17 | 3.54 | 2.28 |
| 6 | 1.45 | 1.03 | 1.05 | 1.13 | 0.84 |
| Total RMSE | 26.59 | 19.50 | 19.33 | 21.20 | 14.66 |
Table 7 gives the RMSE mean and standard deviation of each model over four trajectory-level repeated experiments. The proposed STG-KAN model achieved an RMSE of 15.25 ± 1.28 N·m. This is 33.75% lower than the baseline physical model, 18.45% lower than BP, 23.02% lower than GRU, and 24.47% lower than LSTM. The proposed model therefore obtained the lowest average prediction error.
| Model | RMSE mean ± standard deviation (N·m) |
|---|---|
| Baseline physical model | 23.02 ± 0.91 |
| BP | 18.70 ± 0.96 |
| GRU | 19.81 ± 0.76 |
| LSTM | 20.19 ± 0.83 |
| STG-KAN | 15.25 ± 1.28 |
The comparison shows that BP can improve the overall error to some extent, but it lacks explicit temporal modeling and joint topology modeling, so its compensation effect is limited. LSTM and GRU can use historical information, but they lack explicit topological structure modeling and cannot fully describe the topological coupling among multiple joints. In contrast, STG-KAN jointly represents joint topological coupling and historical dynamic features, so it achieves better prediction accuracy and residual compensation performance for industrial robots.
5.4 Ablation Study and Effectiveness Validation
To verify the contribution of each core module, I conducted ablation experiments on all test trajectories. Three ablation models were designed. Case1 replaced the multi-relation graph convolution with an ordinary fully connected layer. Case2 removed the multi-scale temporal encoding. Case3 replaced the KAN regression head with an ordinary MLP. All other training and testing settings were kept the same as the complete model.
Table 8 reports the prediction results of the proposed model and the ablation models over four trajectory-level repeated experiments. Compared with Case1, Case2, and Case3, the complete STG-KAN model reduced the average RMSE by 14.13%, 19.48%, and 13.01%, respectively. Case1 had a clearly higher error than the complete model, which indicates that explicit joint topology modeling plays an important role in residual compensation. Case2 showed the largest error increase, which indicates that removing multi-scale temporal encoding causes the most significant performance degradation and that temporal information strongly affects residual modeling. Case3 had a relatively smaller error increase but was still higher than the complete model, which indicates that the KAN regression head still contributes to improving residual fitting capability.
| Model | RMSE mean ± standard deviation (N·m) |
|---|---|
| STG-KAN | 15.25 ± 1.28 |
| Case1: no graph module | 17.76 ± 1.62 |
| Case2: no temporal module | 18.94 ± 1.14 |
| Case3: MLP regression head | 17.53 ± 1.38 |
6. Discussion
The experimental results confirm that hybrid modeling is a practical way to improve torque prediction for industrial robots. The baseline physical model provides a reliable and interpretable starting point, but its residual contains systematic structure. My STG-KAN model learns this structure by combining multi-relation graph convolution, multi-scale causal temporal convolution, temporal attention, and a KAN regression head.
The multi-relation graph is important because the dynamics of serial industrial robots are not spatially uniform. Motion states propagate downward along the kinematic chain, while inertial and payload effects propagate upward. Non-adjacent joints also interact through the rigid-body coupling and through the shared base. The prior graph and the learnable correction term allow the model to represent both known topological structure and unknown coupling effects.
The temporal module is also essential. Friction reversal, transmission compliance, and actuator hysteresis produce memory effects that cannot be captured by a purely instantaneous model. Causal dilated convolution enlarges the receptive field without violating causality, and the multi-branch design captures both short and long time scales. The attention readout then focuses on the most relevant historical segments for the current residual.
The KAN regression head improves the approximation of complex nonlinear residuals. Compared with a standard MLP, the KAN structure provides learnable spline basis functions that can represent highly nonlinear mappings with relatively few parameters. This is beneficial for residual compensation in industrial robots, where the residual depends on joint state, direction, load, and history in a complicated manner.
From an application perspective, the proposed method can be used for feedforward control, torque estimation, state monitoring, and high-precision trajectory tracking. Because the baseline model remains physically meaningful, the hybrid model is easier to interpret than a purely black-box neural network. The residual compensation module can be updated when the payload or operating condition changes, which is important for industrial robots that must adapt to different tasks.
7. Conclusion
I proposed a hybrid dynamics modeling method for industrial robots based on STG-KAN residual compensation. The method first uses a physically feasible identification procedure to obtain a baseline dynamic model. It then uses a spatiotemporal graph neural network to compensate for the prediction residual. The network contains a multi-relation adaptive graph convolution module for joint topology coupling, causal dilated convolution and temporal attention for historical dynamic dependence, and a KAN regression head for complex nonlinear residual fitting.
In four trajectory-level repeated experiments on a six-degree-of-freedom industrial robot, the proposed model achieved the lowest average RMSE. The STG-KAN model reached 15.25 ± 1.28 N·m, which is a 33.75% reduction relative to the baseline physical model. It also outperformed several deep learning compensation models, including BP, LSTM, and GRU. The ablation study showed that spatial topology modeling, temporal encoding, and the KAN regression head all contribute to residual compensation accuracy. Overall, the proposed method improves the inverse dynamics prediction accuracy of industrial robots while preserving the interpretability of the baseline physical model. This provides a useful reference for model compensation, feedforward control, and high-precision trajectory tracking in industrial robots.
In future work, I plan to extend the framework to payload-varying conditions, tool-changing scenarios, and long-term online adaptation. I also intend to investigate how the residual compensation model can be integrated with real-time controllers for industrial robots under strict computational constraints. Such extensions would further test the practical value of hybrid dynamics modeling for industrial robots in realistic manufacturing environments.