
As a researcher in mechanical engineering, I have focused on the reliability assessment of precision transmission systems, particularly the RV reducer. The RV reducer, or rotary vector reducer, is a critical component in applications such as industrial robots and aerospace due to its high load capacity, compact design, and excellent torsional stiffness. However, reliability issues often arise from harsh operating conditions and manufacturing tolerances, making it essential to develop robust prediction methods. In this article, I explore a logic fault model-based approach for reliability prediction of the RV reducer system, emphasizing the use of reliability data from similar components and handbook references to forecast system performance over time. This method aims to identify weak links and enhance overall reliability, providing a pathway for more accurate failure distribution analysis and improved mean time between failures (MTBF).
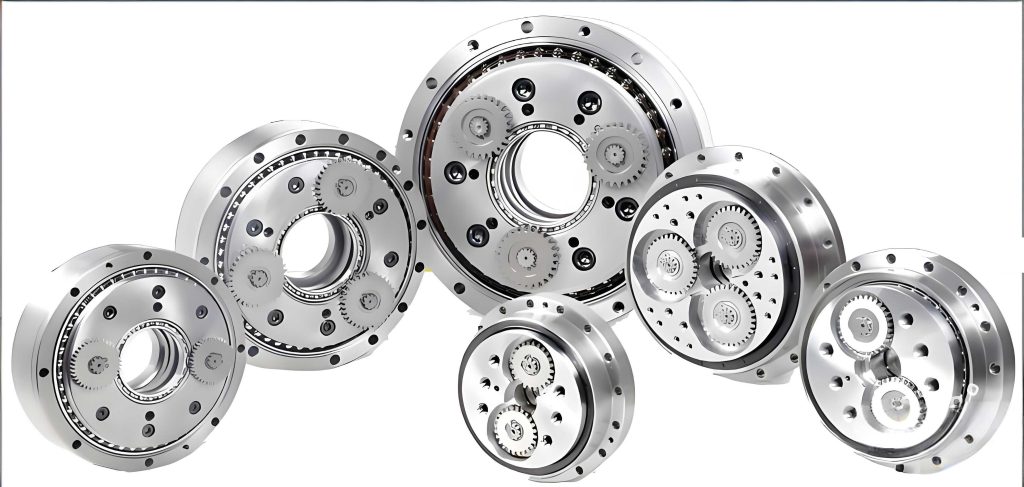
The RV reducer operates as a closed differential gear system, exemplified by models like the RV-40E. Its transmission mechanism involves an input shaft connected to a sun gear, which drives planetary gears in both revolution and rotation motions. These motions are transferred to crank shafts attached to cycloidal gears, engaging with fixed pin gears to produce output through a planetary carrier. This complex interaction among components necessitates a detailed reliability analysis to prevent system failures. Understanding the structure and function of the RV reducer is crucial for building effective reliability models, as each subsystem—such as the planetary gear subsystem and cycloidal gear subsystem—plays a distinct role in overall performance. By examining these subsystems, we can apply logic fault models to predict reliability trends under various connection modes, ultimately leading to design improvements and higher reliability levels.
Reliability prediction for the RV reducer involves estimating whether the designed system meets specified reliability requirements under given operating conditions. This process serves as an analytical tool to provide relative measures of system reliability and identify vulnerabilities for enhancement. Given the high integration and complexity of modern mechanical products like the RV reducer, traditional reliability assessment methods may fall short, necessitating advanced approaches based on fault logic and data-driven models. In this context, I utilize the Non-electronic Parts Reliability Data (NPRD) handbook and similarity principles to predict reliability, ensuring that predictions are grounded in empirical data from analogous components. The prediction process is iterative, involving system definition, failure criteria establishment, environmental analysis, reliability block diagram creation, mathematical modeling, unit reliability estimation, and system-level prediction, followed by reliability allocation and re-prediction as conditions change.
To establish a reliability model for the RV reducer, I first consider the system as a series configuration, where the failure of any single component leads to system failure. This assumption is common in mechanical systems due to interdependencies among parts. The reliability of the RV reducer system, denoted as $R_s(t_s)$, can be expressed mathematically based on the reliability of individual units. For a series system with $n$ independent components, the system reliability is the product of the reliabilities of each component. If each component’s life follows an exponential distribution—a common assumption in reliability engineering—the failure rate function $\lambda_i(t)$ can be integrated to derive the system reliability. This forms the foundation for predicting the RV reducer’s performance over time, with calculations for MTBF providing insights into expected operational lifespan. For instance, the system reliability formula for the RV reducer is:
$$R_s(t_s) = \prod_{i=1}^{n} R_i(t_i) = \prod_{i=1}^{n} e^{-\int_0^t \lambda_i(u) du} = e^{-\int_0^t \sum_{i=1}^{n} \lambda_i(u) du}$$
Here, $\lambda_s(t) = \sum_{i=1}^{n} \lambda_i(t)$ represents the system failure rate, and MTBF is calculated as:
$$\text{MTBF} = \int_0^{\infty} R_s(t) dt = \frac{1}{\lambda_s(t)} \quad \text{(for exponential distribution)}$$
This mathematical framework allows for the reliability prediction of the RV reducer by aggregating failure rates from subsystems. For example, in the planetary gear subsystem of the RV reducer, components such as gears, shafts, bearings, and retainers contribute to overall failure rates. Using NPRD data, I compiled failure rates for each component, as shown in Table 1, to compute the subsystem’s reliability. The planetary gear subsystem consists of multiple parts working in series, and its reliability over time can be plotted to identify trends. Similarly, the cycloidal gear subsystem involves more complex connections, including parallel elements, requiring a mixed-series reliability model. By analyzing these subsystems, I can pinpoint critical components—like bearings—that dominate failure rates and propose design modifications to boost the RV reducer’s reliability.
| Component Name | Component Type | Quantity | Failure Rate (× 10⁶ h⁻¹) |
|---|---|---|---|
| Planetary Gears | Mechanical Device (Gear) | 2 | 0.245 |
| Input Shaft | Mechanical Device (Shaft) | 1 | 1.000 |
| Rolling Bearings | Bearing | 2 | 58.000 |
| Crank Shaft | Mechanical Device | 2 | 3.383 |
| Retaining Rings | Connector | 2 | 1.052 |
For the planetary gear subsystem of the RV reducer, the total failure rate $\lambda_s$ is calculated by summing the failure rates of all components. Based on Table 1:
$$\lambda_s = \sum_{i=1}^{5} \lambda_i = (2 \times 0.245) + (1 \times 1.000) + (2 \times 58.000) + (2 \times 3.383) + (2 \times 1.052) = 63.68 \times 10^{-6} \, \text{h}^{-1}$$
Assuming an exponential distribution, the MTBF for this subsystem is:
$$\text{MTBF} = \frac{1}{\lambda_s} = \frac{1}{63.68 \times 10^{-6}} \approx 15,703.52 \, \text{h}$$
The reliability of the planetary gear subsystem at $t = 1,000$ hours is:
$$R(1000) = \prod_{i=1}^{5} e^{-\lambda_i t} = e^{-63.68 \times 10^{-6} \times 1000} \approx 0.9383$$
Plotting reliability over time reveals a decline; for instance, at $t = 6,000$ hours, reliability drops to approximately 0.6824. Analysis shows that rolling bearings are the weak link, accounting for 91.08% of the subsystem’s failure rate. Improving bearing reliability in the RV reducer could significantly enhance overall system performance. This insight underscores the importance of component-level analysis in reliability prediction for the RV reducer.
Moving to the cycloidal gear subsystem of the RV reducer, the reliability model becomes more complex due to mixed series-parallel connections. The task reliability block diagram for this subsystem includes multiple units arranged in parallel and series configurations, as depicted in reliability schematics. Components such as cycloidal gears, support bearings, needle bearings, pin gears, and housings interact in ways that affect overall reliability. Using NPRD data, I compiled failure rates for these components, as shown in Table 2, to facilitate reliability calculations. The cycloidal gear subsystem involves parallel units that provide redundancy, improving reliability, but also series elements that can lead to cascading failures. By applying reliability formulas for mixed systems, I can compute the subsystem’s reliability over time and identify critical components.
| Component Name | Code | Quantity | Failure Rate (× 10⁶ h⁻¹) |
|---|---|---|---|
| Cycloidal Gears | A | 2 | 15.4 |
| Spacer Rings | B | 1 | 0.001 |
| Support Bearings | C | 2 | 82.60 |
| Crank Shafts | D | 2 | 1.000 |
| Needle Bearings | E | 4 | 78.564 |
| Pin Gears | F | 40 | 5.78 |
| Pin Gear Pins | G | 40 | 1.316 |
| Pin Gear Sleeves | H | 40 | 17.8 |
| Pin Gear Housings | I | 1 | 0.0005 |
| Column Pins | L | 4 | 2.54 |
| Column Pin Sleeves | M | 4 | 5.000 |
| Housing | N | 1 | 0.0001 |
For the cycloidal gear subsystem of the RV reducer, reliability calculations involve both parallel and series units. At $t = 1,000$ hours, the reliability of parallel units is computed using the formula for parallel systems: $R_{\text{parallel}} = 1 – \prod (1 – R_i)$. For example, the parallel unit consisting of cycloidal gears (A) and spacer rings (B) has reliability:
$$R_{(AB)} = 1 – (1 – e^{-\lambda_A t})(1 – e^{-\lambda_B t}) = 1 – (1 – e^{-15.4 \times 10^{-6} \times 1000})(1 – e^{-0.001 \times 10^{-6} \times 1000}) \approx 0.9846$$
Similarly, for other parallel units such as support bearings (C) and crank shafts (D):
$$R_{(CD)} = 1 – (1 – e^{-\lambda_C t})(1 – e^{-\lambda_D t}) \approx 0.9999174$$
For the pin gear assembly (F, G, H, I):
$$R_{(FGHI)} = 1 – (1 – e^{-\lambda_F t})(1 – e^{-\lambda_G t})(1 – e^{-\lambda_H t})(1 – e^{-\lambda_I t}) \approx 0.9999998$$
And for column pins (L) and sleeves (M):
$$R_{(LM)} = 1 – (1 – e^{-\lambda_L t})(1 – e^{-\lambda_M t}) \approx 0.9999873$$
The series units include these parallel results along with other components like needle bearings (E) and housing (N). The overall system reliability for the cycloidal gear subsystem is:
$$R_s = R_{(AB)} \cdot R_{(CD)} \cdot R_{(E)} \cdot R_{(FGHI)} \cdot R_{(LM)} \cdot R_{(N)}$$
Where $R_{(E)} = e^{-\lambda_E t}$ for needle bearings, and $R_{(N)} = e^{-\lambda_N t}$ for housing. Substituting values:
$$R_s \approx 0.9846 \times 0.9999174 \times e^{-78.564 \times 10^{-6} \times 1000} \times 0.9999998 \times 0.9999873 \times e^{-0.0001 \times 10^{-6} \times 1000} \approx 0.91012$$
Plotting reliability over time shows a decline to about 0.5653 at $t = 6,000$ hours. Analysis indicates that support bearings and needle bearings are the primary weak links, contributing 76.74% of the subsystem’s failure rate in the RV reducer. Additionally, cycloidal gears and pin gear sleeves are prone to wear, suggesting that improved heat treatment and installation precision could reduce failure rates. This highlights the value of logic fault models in reliability prediction for the RV reducer, enabling targeted improvements.
In extending the reliability analysis of the RV reducer, it’s important to consider environmental factors and operational stresses that influence failure rates. The RV reducer often operates under variable loads and temperatures, which can accelerate wear and tear on components like bearings and gears. By incorporating stress factors into the reliability model, we can refine predictions. For instance, the failure rate $\lambda_i$ for a component in the RV reducer can be adjusted using a stress model: $\lambda_i = \lambda_b \cdot \pi_T \cdot \pi_E \cdot \pi_Q$, where $\lambda_b$ is the base failure rate from NPRD, and $\pi$ factors account for temperature, environment, and quality. This allows for more accurate reliability predictions tailored to specific application conditions of the RV reducer. Integrating such models with logic fault approaches enhances the robustness of reliability assessments.
Another aspect to explore is the use of Weibull distributions for reliability prediction of the RV reducer. While the exponential distribution is common for its simplicity, the Weibull distribution offers flexibility in modeling varying failure rates over time, which may better reflect the wear-out phases of mechanical components. The reliability function for a Weibull distribution is $R(t) = e^{-(t/\eta)^\beta}$, where $\eta$ is the scale parameter and $\beta$ is the shape parameter. For the RV reducer, components like gears and bearings might exhibit $\beta > 1$, indicating increasing failure rates with time. By fitting Weibull parameters to failure data from similar RV reducer systems, we can improve prediction accuracy. This approach complements logic fault models by providing a more nuanced view of failure mechanisms in the RV reducer.
Furthermore, reliability prediction for the RV reducer can benefit from simulation techniques such as Monte Carlo methods. These methods involve random sampling of component failure times based on their distributions to estimate system reliability statistically. For the RV reducer, a Monte Carlo simulation could model the entire system with thousands of iterations, accounting for uncertainties in failure rates and operational conditions. This provides a probabilistic reliability forecast, offering insights into confidence intervals and risk levels. Combining simulation with logic fault models creates a comprehensive framework for reliability prediction of the RV reducer, enabling designers to evaluate different scenarios and optimize system architecture.
In terms of practical applications, the reliability prediction methodology for the RV reducer has implications for maintenance strategies and lifecycle management. By identifying weak components, such as bearings in the planetary gear subsystem, maintenance schedules can be optimized to replace these parts proactively, reducing downtime and costs. For the RV reducer used in critical applications like robotics, predictive maintenance based on reliability forecasts can enhance operational safety and efficiency. Additionally, reliability data collected from fielded RV reducer systems can feed back into the prediction models, creating a continuous improvement loop. This iterative process aligns with the reliability prediction and allocation cycle, ensuring that the RV reducer evolves to meet higher reliability standards.
To summarize, reliability prediction for the RV reducer based on logic fault models involves several key steps: system definition, failure criteria establishment, reliability block diagram creation, mathematical modeling, and data-driven estimation. Using NPRD and similarity principles, I calculated reliability for subsystems like the planetary gear and cycloidal gear systems, identifying bearings as critical weak points. The formulas and tables presented illustrate how reliability metrics like MTBF and $R(t)$ are derived, providing a quantitative basis for design decisions. For the RV reducer, improving bearing reliability through better materials or design can significantly boost overall system reliability, as shown by the failure rate contributions. Future work could integrate more advanced distributions, stress models, and simulations to further refine predictions for the RV reducer.
In conclusion, the logic fault model approach offers a effective pathway for reliability prediction of the RV reducer, leveraging existing data and mathematical frameworks to forecast system performance. By analyzing component failure rates and subsystem configurations, we can pinpoint vulnerabilities and propose enhancements, ultimately increasing the reliability and MTBF of the RV reducer. This methodology not only aids in design optimization but also supports maintenance planning and risk management for the RV reducer in demanding applications. As reliability engineering advances, incorporating these predictions into the development lifecycle of the RV reducer will be crucial for achieving higher standards of performance and durability.