
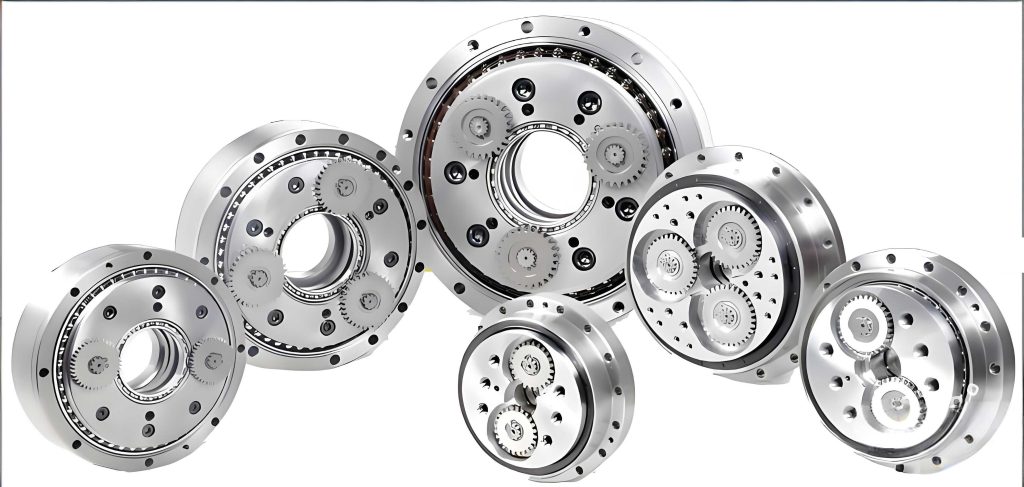
As a precision transmission component, the rotary vector reducer has become indispensable in high-accuracy motion systems. Characterized by a two-stage mechanism combining a primary involute planetary gear train with a secondary cycloidal drive, this reducer offers exceptional advantages: high torque capacity, compact size, excellent torsional rigidity, and minimal backlash. Its performance directly influences the precision, reliability, and lifespan of the equipment it serves, such as industrial robots and precision rotary tables. Consequently, accurately evaluating the comprehensive performance parameters of a rotary vector reducer—including torsional stiffness, transmission error, efficiency, and dynamic response—is paramount. This evaluation necessitates a dedicated, high-precision test bench, the structural integrity of which forms the cornerstone of reliable measurement data. Any deformation or vibration in the test bench frame can introduce significant errors, masking the true performance of the device under test. Therefore, a thorough investigation into the static and dynamic characteristics of the test bench itself is a critical prerequisite for establishing a trustworthy evaluation platform for rotary vector reducers.
This analysis adopts a first-person perspective, detailing the process of designing, modeling, and simulating the test bench structure. The primary objective is to assess its mechanical behavior under operational loads and its inherent dynamic properties to ensure it meets the stringent requirements for testing high-precision rotary vector reducers. The methodology relies heavily on Finite Element Analysis (FEA), a powerful computational tool that allows for the prediction of stress, strain, deformation, and vibration modes without the need for physical prototyping. By employing this virtual simulation approach, potential design flaws can be identified and rectified early in the development cycle, leading to an optimized structure that is both robust and economical in terms of material usage.
1. Test Bench Layout and Structural Design Philosophy
The design of the test bench is driven by the need to accommodate a suite of measurement instruments while maintaining supreme stability. The layout must facilitate the sequential connection of drive and load units aligned with the rotary vector reducer under test. A typical configuration involves a servo motor as the prime mover, followed by a high-resolution rotary encoder to measure input angle. The rotary vector reducer is then mounted onto a rigid platform. Its output shaft connects, through a torque sensor, to a braking or servo-loading unit that applies a controlled resistive torque. This arrangement allows for the measurement of input/output torque, speed, angular position, and temperature under various load conditions.
The structural skeleton of the test bench, often called the frame or bed, is the focus of this analysis. Its primary function is to provide a geometrically stable and stiff foundation for mounting all components. Any relative displacement between mounting points (e.g., between the motor flange and the loading unit base) directly translates into measurement error or undesirable parasitic loads on the rotary vector reducer. The design philosophy emphasizes high static stiffness to resist bending under the weight of equipment and dynamic stiffness to avoid resonant vibrations excited by operational forces.
For this study, the frame is constructed primarily from hot-rolled structural steel, specifically Q235 grade, chosen for its favorable balance of strength, weldability, and cost. The conceptual design features a horizontal tabletop plate supported by vertical columnar structures at its ends. These support columns are braced with horizontal and diagonal cross-members to enhance overall torsional and bending rigidity. All sharp corners are filleted to reduce stress concentrations. The key properties of Q235 steel used for the simulation are summarized in Table 1.
| Material Property | Symbol | Value | Unit |
|---|---|---|---|
| Young’s Modulus | E | 210,000 | MPa |
| Poisson’s Ratio | ν | 0.3 | – |
| Density | ρ | 7.85e-9 | tonne/mm³ |
| Yield Strength | σ_y | 235 | MPa |
| Tensile Strength | σ_u | 407 | MPa |
The total mass of all instrumentation (servo motor, sensors, couplings, loading device) estimated to be mounted on the bench is approximately 340 kg. This distributed load is the primary operational static load. The force exerted by this equipment is converted into a uniform pressure acting on the tabletop’s effective supporting area. The gravitational acceleration is taken as 9.8 m/s². The calculated pressure \( P \) is given by:
$$
P = \frac{F}{A} = \frac{m \cdot g}{A} = \frac{340 \, \text{kg} \times 9.8 \, \text{m/s}^2}{A \, \text{m}^2}
$$
Assuming an effective tabletop area \( A \) of 1.8 m² (e.g., 2.0m x 0.9m), the pressure calculates to approximately 1.85 kPa. While this pressure is small, its effect over the span of the frame, combined with the structure’s self-weight, must be carefully evaluated to ensure deformations remain within acceptable micrometric limits for testing a precision rotary vector reducer.
2. Finite Element Modeling and Static Structural Analysis
The first step in the virtual analysis is creating an accurate yet computationally efficient finite element model. The detailed 3D CAD model of the test bench frame is simplified by suppressing non-critical small features like minor fastener holes and very small fillets that would unnecessarily complicate the mesh. The simplified geometry is then imported into the ANSYS Workbench simulation environment. The material properties from Table 1 are assigned to the entire frame structure.
A critical step is meshing—discretizing the geometry into small, solvable elements. Given the frame’s size, a balance between accuracy and solve time is sought. A sweep-based meshing method with hexahedral-dominant elements is employed, as they generally provide better accuracy for bending-dominated problems compared to tetrahedral elements. The final mesh consists of approximately 34,700 elements and 22,200 nodes, deemed sufficient for a global stiffness and stress analysis.
The boundary conditions are applied to represent the physical installation: the bottom surfaces of all support column feet are fully fixed (all degrees of freedom constrained), simulating a bolted connection to a rigid factory floor. The loads applied are:
1. Standard Earth Gravity: A 9.8 m/s² acceleration is applied to the entire structure to account for its self-weight.
2. Equipment Pressure: The calculated uniform pressure of 1.85 kPa is applied vertically downward on the tabletop surface.
The linear static structural analysis solves the equilibrium equation:
$$
[K]\{u\} = \{F\}
$$
where \([K]\) is the global stiffness matrix, \(\{u\}\) is the vector of nodal displacements, and \(\{F\}\) is the vector of applied nodal forces (from pressure and gravity). The solution yields the deformation and stress fields throughout the structure.
The results of the static analysis are conclusive and positive for the testing of a rotary vector reducer. The maximum equivalent (von-Mises) stress in the entire frame is found to be only 2.07 MPa, located at the junction between a horizontal bracing member and a vertical support column. This stress level is nearly two orders of magnitude below the yield strength of Q235 steel (235 MPa), indicating a very high factor of safety and no risk of plastic deformation or structural failure.
The deformation results are of greater interest for precision alignment. The total deformation plot shows a maximum deflection of about 0.010 mm, occurring at the center of a long, unsupported horizontal cross-member. Crucially, the deformation of the tabletop surface—the critical mounting platform for the rotary vector reducer and its drive/load units—is significantly smaller. The vertical displacement (Z-direction) of the tabletop ranges between 0.003 mm and 0.004 mm. This level of deformation, on the order of a few microns, is typically within the acceptable tolerance for aligning high-precision mechanical components and is unlikely to introduce significant error in the evaluation of a rotary vector reducer’s backlash or stiffness. Key static performance metrics are summarized in Table 2.
| Performance Metric | Value | Location/Comment |
|---|---|---|
| Max. von-Mises Stress | 2.07 MPa | At brace-to-column connection |
| Max. Total Deformation | ~0.010 mm | Mid-span of a horizontal brace |
| Tabletop Vertical Deformation Range | 0.003 – 0.004 mm | Critical for component alignment |
| Factor of Safety (Yield) | > 110 | Based on σ_max and σ_y |
3. Dynamic Characterization: Modal Analysis
While static stiffness is vital, the dynamic behavior of the test bench is equally important. A structure will vibrate more easily when excited at frequencies close to its natural frequencies (modes). If the operational forces from the servo motor, the meshing of the rotary vector reducer’s gears, or the loading unit contain energy at these frequencies, resonance can occur. This leads to amplified vibrations that can corrupt sensor signals (e.g., from torque or encoder sensors) and potentially cause fatigue damage over time. Modal analysis is performed to identify these inherent dynamic characteristics.
Modal analysis determines the natural frequencies and corresponding mode shapes of an undamped structure. It solves the eigenvalue problem derived from the free-vibration equations. Ignoring damping for modal extraction, the equation of motion is:
$$
[M]\{\ddot{u}\} + [K]\{u\} = \{0\}
$$
Assuming harmonic motion \(\{u\} = \{\phi\} \cos(\omega t)\), the equation simplifies to the classical eigenvalue problem:
$$
\left( [K] – \omega^2 [M] \right) \{\phi\} = \{0\}
$$
For a non-trivial solution, the determinant must be zero:
$$
\text{det}\left( [K] – \omega^2 [M] \right) = 0
$$
Solving this yields \(n\) eigenvalues \(\omega_i^2\), where \(\omega_i\) is the \(i\)-th natural frequency (in rad/s), and \(n\) corresponding eigenvectors \(\{\phi_i\}\), which describe the \(i\)-th mode shape.
For the test bench frame, the first six natural frequencies and their associated mode shapes are extracted using the Block Lanczos solver. The results, detailed in Table 3 and described below, reveal the fundamental dynamic personality of the structure.
| Mode Order | Natural Frequency (Hz) | Description of Mode Shape |
|---|---|---|
| 1 | 162.7 | Global torsional mode about a vertical axis, involving twisting of the tabletop. |
| 2 | 168.5 | First global bending mode, primarily vertical (Z-direction) vibration of the tabletop. |
| 3 | 181.1 | Local vertical vibration mode of the central horizontal cross-member. |
| 4 | 187.4 | Complex bending mode involving combined deformation of the cross-members and support columns. |
| 5 | 207.2 | Global lateral (X-direction) swaying mode of the entire frame. |
| 6 | 218.9 | Higher-order vertical bending mode with multiple nodes in the support structure. |
The first mode at 162.7 Hz is a torsional mode, which is often the most critical for machinery frames as it can be excited by asymmetric loading or drive reactions. The subsequent modes are bending modes in different directions. It is important to note that these frequencies are relatively high (>160 Hz), which is generally favorable. The typical operational and switching frequencies associated with driving and loading a rotary vector reducer (e.g., motor shaft speed and its harmonics, gear mesh frequencies) are usually much lower than 100 Hz for standard reduction ratios. Therefore, there is a comfortable separation between the expected excitation frequencies and the fundamental natural frequencies of the test bench, reducing the risk of resonance during normal testing of the rotary vector reducer.
4. Dynamic Characterization: Harmonic Response Analysis
To further quantify the dynamic performance under sustained periodic loads, a harmonic response analysis is conducted. This type of analysis calculates the steady-state response of the structure when subjected to sinusoidally varying loads. It answers the question: “What is the vibration amplitude at any point on the structure if it is excited by a force at a specific frequency?” This is crucial for predicting forced vibration levels, especially at frequencies below resonance where the system is stiffness-controlled, and near resonance where amplification occurs.
The governing equation for a damped system under harmonic excitation is:
$$
[M]\{\ddot{u}\} + [C]\{\dot{u}\} + [K]\{u\} = \{F\} \sin(\Omega t)
$$
where \([C]\) is the damping matrix, \(\Omega\) is the excitation frequency (in rad/s), and \(\{F\}\) is the amplitude vector of the harmonic load. The steady-state displacement response is also harmonic, of the form \(\{u\} = \{A\} \sin(\Omega t + \theta)\), where \(\{A\}\) is the amplitude vector and \(\theta\) is the phase lag relative to the excitation.
For this analysis, a harmonic force of constant amplitude is conceptually applied to represent potential dynamic forces from the test setup. The frequency range of interest is swept from 0 to 250 Hz, encompassing the first six natural frequencies. The output of primary concern is the displacement frequency response function (FRF) at key points on the tabletop surface—specifically, the amplitude of vibration in the X, Y, and Z directions as a function of excitation frequency.
The results are highly encouraging. The displacement FRF curves show pronounced peaks at the natural frequencies identified in the modal analysis, confirming the modal extraction. The maximum vibration amplitude observed across the entire frequency sweep, occurring at a resonant peak, is on the order of \(3.88 \times 10^{-6}\) mm (approximately 3.9 nanometers). This is an extremely small displacement, indicating that even at resonance, the absolute vibration level of the tabletop is negligible. More importantly, in the lower frequency range (e.g., below 100 Hz, where most operational excitations for a rotary vector reducer would lie), the vibration amplitudes are even smaller, typically below \(1 \times 10^{-7}\) mm. This demonstrates that the test bench possesses excellent dynamic stiffness, ensuring that vibrational noise will not interfere with the sensitive measurements required to characterize the performance of a rotary vector reducer, such as its minute angular transmission errors or subtle torque fluctuations.
5. Conclusion and Implications for Rotary Vector Reducer Testing
This comprehensive static and dynamic finite element analysis of the proposed test bench frame provides a solid theoretical foundation for its design and validates its suitability for high-precision testing applications. The static analysis reveals that the structural integrity is more than adequate, with maximum operational stresses being a negligible fraction of the material’s yield strength. The critical deformation metric—the vertical deflection of the mounting tabletop—is confined to a range of 3-4 micrometers. This level of static compliance is generally acceptable for the alignment of mechanical drive trains and is unlikely to be a dominant source of error in testing a rotary vector reducer.
The dynamic analysis offers deeper insight. The modal analysis identifies the fundamental natural frequencies, all lying above 160 Hz, which provides a significant margin against common excitation frequencies from motors and gearboxes. The harmonic response analysis quantifies the forced vibration response, confirming that displacement amplitudes are vanishingly small, on the order of nanometers, across the operational frequency spectrum. This exceptional dynamic stiffness ensures that the test bench itself will not contribute spurious vibrations that could mask the true dynamic characteristics of the rotary vector reducer under evaluation, such as its natural frequency or damping ratio.
In summary, the FEA-driven design process confirms that the test bench frame possesses the necessary static strength and, more importantly, the superior static and dynamic stiffness required to serve as a reliable and accurate platform for evaluating the nuanced performance metrics of a rotary vector reducer. The methodology outlined—combining CAD modeling, finite element meshing, static structural analysis, modal analysis, and harmonic response analysis—provides a robust template for the design and virtual validation of similar precision test equipment. By identifying and addressing potential mechanical issues in the virtual domain, this approach significantly de-risks the manufacturing process, shortens development time, and ultimately contributes to the creation of a test bench capable of delivering the high-fidelity data essential for advancing the design and quality control of rotary vector reducers.