
In recent years, the rapid advancement of robotics has brought humanoid robots from industrial laboratories into everyday life and commercial service scenarios. As these robots increasingly share physical and social spaces with people, the quality of human–robot interaction becomes a decisive factor for their acceptance and long-term adoption. I have observed that many current humanoid robot designs are primarily driven by engineering considerations, focusing on functionality, structural integrity, and sensor integration. This often results in a cold, rigid, and machinelike appearance that can evoke feelings of discomfort, distrust, or even fear among users. My research addresses this critical gap by systematically exploring what makes a humanoid robot’s appearance feel approachable and trustworthy, and by leveraging artificial intelligence to generate design solutions that embody the elusive quality we call affinity.
The concept of affinity in product design refers to the degree to which a product resonates with the user’s physiological and psychological needs, creating a pleasant, comfortable, and relaxed emotional experience. For humanoid robots, affinity is not merely an aesthetic preference; it directly influences the user’s willingness to interact, cooperate, and rely on the robot. I argue that a thorough investigation into the design features that contribute to affinity is essential before attempting to train generative models. Without a precise, quantifiable understanding of what constitutes a “friendly” robot face, body proportion, material texture, and color scheme, any AI-driven design tool is likely to produce arbitrary or inconsistent results. Therefore, my methodology integrates kansei engineering—a well-established approach for translating human emotional responses into concrete design parameters—with advanced stable diffusion model training.
Through this integrated framework, I first conducted a large-scale questionnaire study to measure user perceptions across three independent dimensions: affinity, gentleness, and liveliness. I then applied non-parametric statistical tests and regression analyses to derive a detailed scoring table that connects specific design attributes to their affinity contributions. This scoring table served as the foundation for curating and annotating training samples for a stable diffusion model. I trained the model using the Dreambooth methodology to produce a primary design generation engine, while multiple LoRA (Low-Rank Adaptation) modules were trained as style enhancers. The resulting model can generate hundreds of diverse humanoid robot appearance concepts within minutes, and the scoring table allows designers to quickly identify which generated concepts achieve the highest affinity. The entire approach not only accelerates the design process but also establishes a reproducible, data-driven path toward emotionally resonant robotic design.
In the following sections, I present the complete research process: the design exploration based on kansei engineering, the construction of the affinity scoring framework, the statistical validation, the stable diffusion training procedure, and the evaluation of generated design candidates. I also discuss the limitations of the current study and propose future directions for cultural adaptation and multimodal affective design.
1. Methodology Overview
My research design follows a sequential mixed-method approach. First, I collected a wide range of humanoid robot appearance samples and abstracted them into isolated design elements, including head shape, eye shape, body proportion, material type and surface treatment, and color scheme. Second, I recruited participants to rate these abstracted visual stimuli using semantic differential scales for three emotional dimensions. Third, I analyzed the rating data to derive quantitative affinity scores for every design feature. Fourth, I used these scores to select and edit training images for the stable diffusion model. Finally, I trained the model and verified its output quality through systematic evaluation with the affinity scoring table. The following sections detail each step.
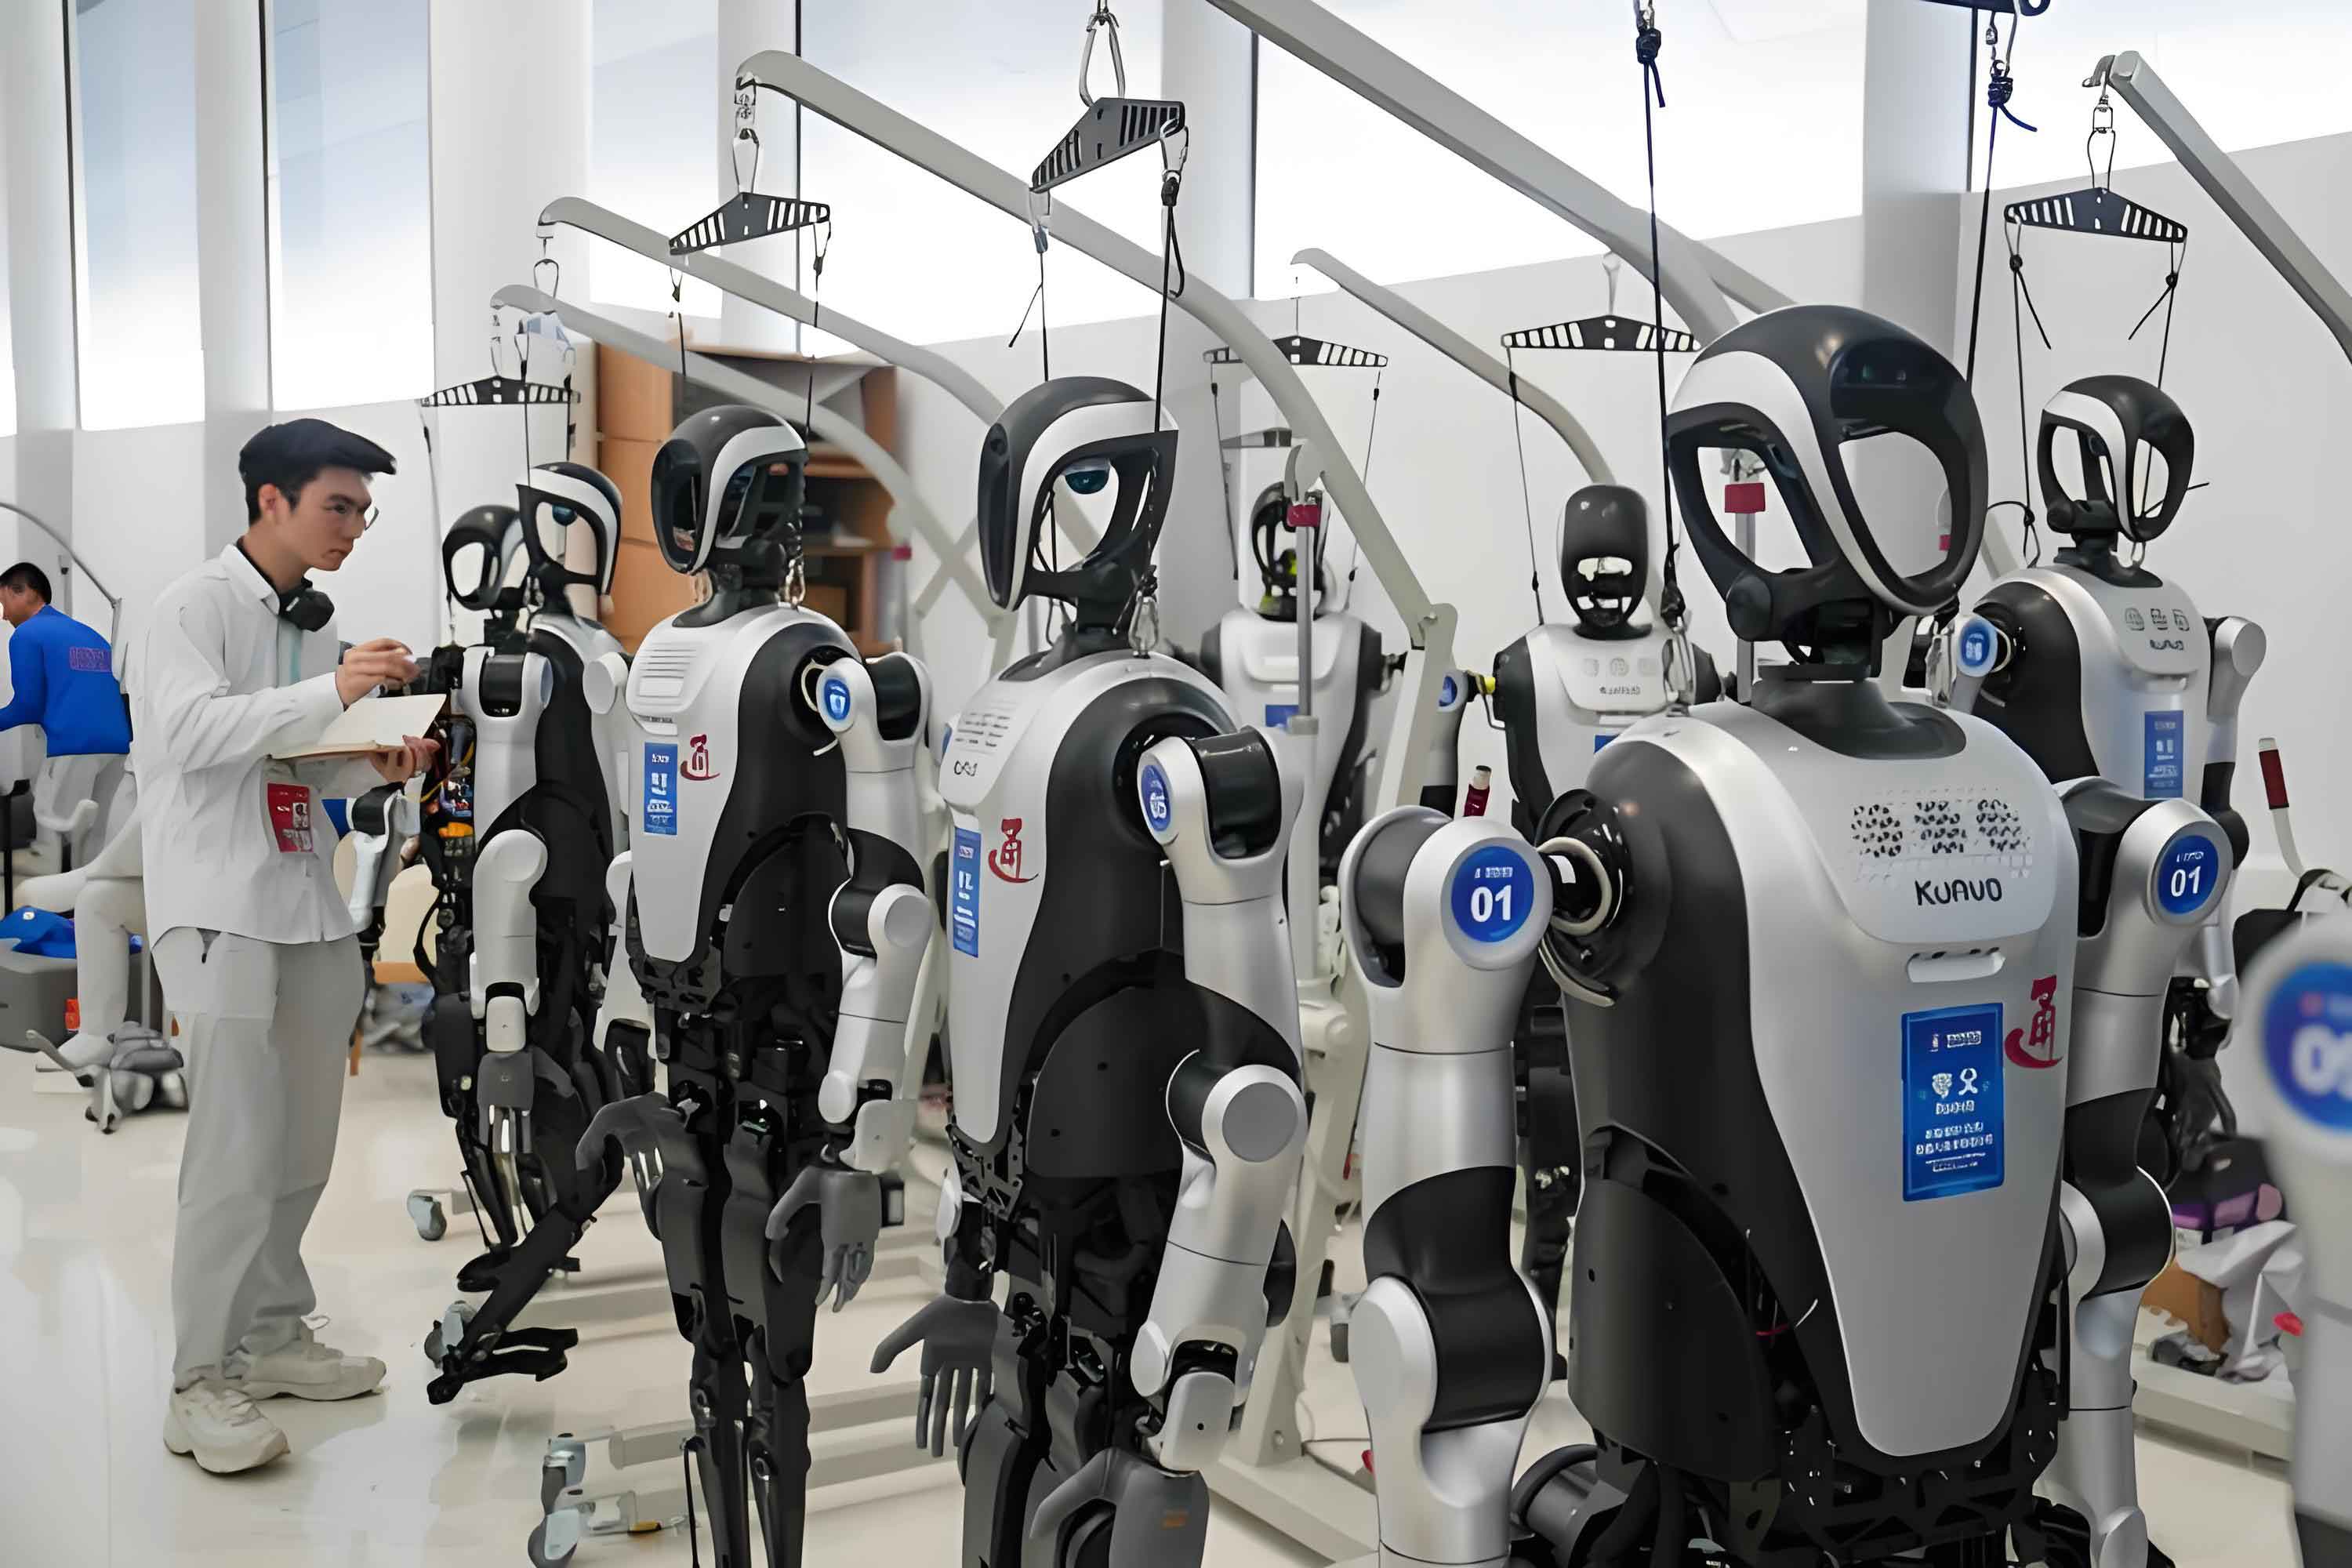
The figure above illustrates the quality inspection of a humanoid robot—a typical scenario where the robot’s visual design directly shapes the user’s initial impressions. The careful evaluation of every design detail, including the curvature of the head, the shape of the eyes, the choice of materials, and the overall body proportions, is crucial for creating an emotionally appealing humanoid robot. My automated inspection process, guided by the affinity scoring table, ensures that each generated concept meets the highest emotional design standards.
2. Kansei Engineering Approach for Affinity Measurement
Kansei engineering is a powerful methodology that links consumers’ emotional responses to specific product design attributes. In my study, I treated “affinity” as a latent variable that can be decomposed into three measurable sub-dimensions:
- Affinity Degree (A) – the direct feeling of closeness and friendliness that a humanoid robot evokes.
- Gentleness Degree (G) – the perceived tenderness, care, and warmth conveyed through the robot’s style and temperament.
- Liveliness Degree (L) – the perceived vitality, activity, and playfulness of the humanoid robot.
To operationalize these sub-dimensions, I initially compiled a list of 30 pairs of contrasting adjectives related to affinity. After removing synonymous or ambiguous pairs, a panel of 25 design experts voted to select the most representative pair for each dimension:
- For Affinity Degree: “cold vs. affectionate”
- For Gentleness Degree: “hard vs. soft”
- For Liveliness Degree: “serious vs. playful”
These three bipolar scales were then used in a semantic differential questionnaire, where participants rated each visual stimulus on a 7-point scale (1 = negative pole, 7 = positive pole).
3. Questionnaire Design and Stimulus Preparation
To investigate the isolated effects of different design elements on the perceived affinity of a humanoid robot, I created a series of abstract visual stimuli. These stimuli were carefully controlled to represent common categories within each design element without introducing confounding factors from real product logos or brand identities.
3.1 Head Shapes
I identified five common head shapes for humanoid robots:
- A1: Square
- A2: Circle
- A3: Vertical rounded rectangle (pill-shaped)
- A4: Horizontal rounded rectangle
- A5: Semicircle
3.2 Eye Shapes
Four eye shape variants were designed:
- B1: Circular
- B2: Square
- B3: Vertical rounded rectangle
- B4: Horizontal rounded rectangle
3.3 Body Proportions
I created seven body proportion models representing different age groups and body builds:
- C1: Infantile (toddler-like)
- C2: Child, sturdy build
- C3: Child, slender build
- C4: Adolescent, slender build
- C5: Adolescent, sturdy build
- C6: Adult, sturdy build
- C7: Adult, slender build
3.4 Materials and Surface Treatments
Four material categories were tested, each with two surface finish variants:
- Plastic: D1 (glossy, smooth), D2 (matte, textured)
- Fabric: D3 (fluffy/plush), D4 (woven/knit)
- Metal: D5 (polished), D6 (brushed)
- Transparent material: D7 (clear), D8 (frosted)
3.5 Color Scheme
I selected a range of colors including neutral colors (white, gray, black), warm hues (yellow, orange, red) at two saturation levels (high and low), and cool hues (green, blue, purple) also at two saturation levels. All colors were presented with controlled brightness values to avoid luminance confounds.
The final questionnaire consisted of a series of pages, each showing one isolated design element (e.g., only the head shape, or only a material swatch) with the three semantic differential scales beneath it. A total of 645 valid responses were collected from a diverse sample of users.
4. Data Analysis Framework
The collected data were analyzed using a combination of statistical techniques, depending on the data type and measurement level. For ordinal data (e.g., 7-point Likert-scale ratings of head shapes), I used Kruskal-Wallis H tests for comparing multiple groups and Mann-Whitney U tests for comparing two groups. For continuous variables (e.g., color parameters), I employed Pearson or Spearman correlation analyses and simple linear regression models. All analyses were performed with a significance level of 0.05.
To quantify the relationships among the three affinity dimensions, I computed correlation coefficients. Table 1 presents the Kendall’s tau correlation coefficients for the ordinal design elements.
| Design Element | Affinity–Gentleness | Affinity–Liveliness | Gentleness–Liveliness |
|---|---|---|---|
| Head shape | 0.356** | 0.303** | 0.284** |
| Eye shape | 0.318** | 0.345** | 0.368** |
| Body proportion | 0.160** | 0.113** | 0.152** |
| Plastic | 0.048** | −0.006 | −0.060** |
| Fabric | −0.016 | −0.006 | −0.020 |
| Metal | 0.029 | −0.010 | 0.028 |
| Transparent | −0.001 | 0.013 | −0.032 |
| White/Gray/Black | 0.294** | 0.319** | 0.301** |
| High-sat warm colors | 0.055** | 0.006 | 0.038* |
| Low-sat warm colors | −0.020 | 0.004 | −0.003 |
| High-sat cool colors | 0.047** | −0.020 | −0.007 |
| Low-sat cool colors | 0.032 | 0.006 | −0.019 |
Note: * p < 0.05, ** p < 0.01.
For continuous material and color parameters, Pearson correlations were computed, as shown in Table 2.
| Variable | Affinity–Gentleness | Affinity–Liveliness | Gentleness–Liveliness |
|---|---|---|---|
| Four material categories | 0.501** | 0.148** | 0.143** |
| Warm color high vs. low saturation | 0.144** | −0.062* | 0.007 |
| Cool color high vs. low saturation | 0.121** | 0.016 | 0.035 |
| White vs. high saturation | 0.280** | 0.158** | 0.180** |
| White vs. low saturation | 0.155** | 0.128** | 0.134** |
The strong positive correlations among the three affinity dimensions across all design elements confirm that they are consistently measuring a unified underlying construct. An interesting finding is that for material surface treatments and warm color saturations, the affinity–liveliness correlation was negative, meaning that as liveliness increased, affinity decreased. This suggests that highly vivid or playful appearances may not always be perceived as friendly or approachable in a humanoid robot.
5. Affinity Scores for Design Features
Since the rating data was ordinal, I used median values with interquartile ranges to summarize the central tendency and dispersion. A median score above 3 (on the 1–7 scale) indicates a positive evaluation. Table 3 shows the Kruskal-Wallis H test results for head shapes, eye shapes, and body proportions.
| Design Element | Category | Affinity Degree | Gentleness Degree | Liveliness Degree |
|---|---|---|---|---|
| Head shape | A1 Square | 6 (5,7) | 6 (5,7) | 6 (5,7) |
| A2 Circle | 6 (5,6) | 6 (5,6) | 6 (5,6) | |
| A3 Vertical rounded rectangle | 3 (2,4) | 3 (2,4) | 4 (3,5) | |
| A4 Horizontal rounded rectangle | 6 (5,7) | 6 (5,7) | 6 (5,7) | |
| A5 Semicircle | 3 (2,4) | 3 (2.5,4.5) | 4 (3,5) | |
| Eye shape | B1 Circular | 4 (4,5) | 4 (3,5) | 4 (3,5) |
| B2 Square | 4 (4,5) | 4 (4,5) | 4 (4,5) | |
| B3 Vertical rounded rectangle | 6 (5,7) | 6 (5,7) | 6 (5,7) | |
| B4 Horizontal rounded rectangle | 3 (2,3) | 3 (2,3) | 2 (2,3) | |
| Slender bodies | C1 Infantile | 6 (5,6) | 5 (5,6) | 5 (5,6) |
| C3 Child | 6 (5,7) | 6 (5,7) | 6 (5,6) | |
| C4 Adolescent | 6 (4,6) | 5 (5,6) | 5 (4,6) | |
| Sturdy bodies | C2 Child | 5 (4,6) | 5 (4,6) | 5 (4,6) |
| C5 Adolescent | 5 (4,6) | 6 (5,6) | 5 (3,5) | |
| C6 Adult | 4 (3,5) | 4 (3,5) | 4 (3,5) | |
| C7 Adult | 4 (3,5) | 3 (2,4) | 4 (3,5) |
Among head shapes, the horizontal rounded rectangle (A4) achieved the highest affinity, followed closely by the circle (A2). The vertical rounded rectangle (A3) and semicircle (A5) were rated low, indicating that these forms are less approachable. For eye shapes, the vertical rounded rectangle (B3) was the clear favorite, while the horizontal rounded rectangle (B4) scored the lowest. Regarding body proportions, the infantile and child-like slender bodies (C1, C3) received the highest affinity scores, whereas adult sturdy bodies (C6, C7) were perceived as less friendly.
Table 4 presents the Mann-Whitney U test results for material and surface treatment comparisons.
| Material | Surface | Affinity Degree | Gentleness Degree | Liveliness Degree |
|---|---|---|---|---|
| Plastic | D1 Glossy | 4 (3,5) | 4 (3,5) | 5 (4,5) |
| Plastic | D2 Mat/Textured | 5 (4,5) | 5 (4,5) | 4 (3,5) |
| Fabric | D3 Fluffy | 6 (5,7) | 6 (5,7) | 5 (4,6) |
| Fabric | D4 Woven | 6 (5,7) | 6 (4,6) | 5 (4,6) |
| Metal | D5 Polished | 2 (1,3) | 2 (1,3) | 4 (2,5) |
| Metal | D6 Brushed | 2 (1,4) | 2 (1,4) | 4 (3,6) |
| Transparent | D7 Clear | 4 (3,5) | 4 (2,5) | 5 (4,6) |
| Transparent | D8 Frosted | 4 (4,5) | 4 (3,5) | 4 (3,5) |
Fabric materials, especially the fluffy surface, produced the highest affinity ratings. Plastic and transparent materials had moderate scores, with matte/frosted surfaces always scoring higher than glossy/clear ones. Metal materials, despite their high liveliness scores, were rated extremely low on affinity, suggesting that raw metal surfaces are detrimental to creating an approachable humanoid robot.
To examine how progressively changing within an ordinal variable affected the affinity ratings, I performed Spearman correlation analyses for ordered variables such as body height (from small to large), neutral color value (white to black), and hue positions in the HSB color wheel. Table 5 summarizes these monotonic trends.
| Variable | Affinity Degree | Gentleness Degree | Liveliness Degree |
|---|---|---|---|
| Overall height (low to high) | −0.340** | −0.427** | −0.340** |
| Slender body height | −0.011 | −0.037 | −0.089** |
| Sturdy body height | −0.379** | −0.541** | −0.355** |
| Neutral color white→black | −0.613** | −0.622** | −0.633** |
| High-sat warm hue (right→left in HSB) | 0.102** | 0.068** | 0.054** |
| Low-sat warm hue (right→left) | 0.071** | 0.095** | 0.095** |
| High-sat cool hue (left→right) | 0.220** | 0.228** | −0.072** |
| Low-sat cool hue (left→right) | 0.067** | 0.145** | −0.078** |
These results clearly show that taller humanoid robots are perceived as less friendly, with the effect being much stronger for sturdy builds than for slender builds. White is the most affectionate neutral color, while black is the least. For warm colors, moving toward the red-orange side increases affinity, whereas for cool colors, moving toward the blue-purple side increases affinity. Overall, lower saturation colors always outperform higher saturation colors in terms of affinity, with the following order: low-saturation warm colors > white > high-saturation warm colors > low-saturation cool colors > high-saturation cool colors.
To compare the effects of color categories quantitatively, I performed a set of simple linear regression analyses. The reference group for each comparison is indicated in Table 6. Positive coefficients mean that the latter group has a stronger positive effect on affinity; negative coefficients indicate the former group is more favorable.
| Comparison | Affinity Degree | Gentleness Degree | Liveliness Degree |
|---|---|---|---|
| High vs. Low saturation (warm) | 0.867 | 0.672 | −0.208 |
| High vs. Low saturation (cool) | 0.855 | 0.668 | −0.012 |
| White vs. High-sat cool | −1.633 | −1.647 | −0.705 |
| White vs. High-sat warm | −0.466 | −0.273 | 0.421 |
| White vs. Low-sat cool | −0.778 | −0.979 | −0.717 |
| White vs. Low-sat warm | 0.401 | 0.399 | 0.213 |
These regression results confirm that low-saturation warm colors (e.g., pastel yellow, soft orange) are the most effective for creating a high-affinity humanoid robot, followed by white. High-saturation cool colors such as vivid blue or purple should be avoided in the design of an approachable robot.
6. Constructing the Affinity Scoring Table
Based on the comprehensive statistical analyses, I synthesized all findings into a single numerical scoring table. Each design feature was assigned an integer score from 0 to 4, where a higher score indicates a stronger positive contribution to the overall affinity of a humanoid robot. This table serves as the primary reference for both the human designer and the AI model. Table 7 presents the final affinity scoring table used in my training pipeline.
| Feature | Code | Score | Feature | Code | Score |
|---|---|---|---|---|---|
| Head A1 | Square | 3 | Eye B4 | Horizontal round rect | 0 |
| Head A2 | Circle | 3 | Body C1 | Infantile | 3 |
| Head A3 | Vertical round rect | 0 | Body C2 | Child sturdy | 2 |
| Head A4 | Horizontal round rect | 3 | Body C3 | Child slender | 4 |
| Head A5 | Semicircle | 0 | Body C4 | Adolescent slender | 4 |
| Eye B1 | Circular | 1 | Body C5 | Adolescent sturdy | 2 |
| Eye B2 | Square | 1 | Body C6 | Adult sturdy | 1 |
| Eye B3 | Vertical round rect | 3 | Body C7 | Adult slender | 0 |
| Material D1 | Plastic glossy | 1 | Color E1 | White | 4 |
| Material D2 | Plastic matte | 2 | Color E2 | Gray | 2 |
| Material D3 | Fabric fluffy | 3 | Color E3 | Black | 2 |
| Material D4 | Fabric woven | 3 | Color E4 | High-sat warm | 1 |
| Material D5 | Metal polished | 0 | Color E5 | Low-sat warm | 3 |
| Material D6 | Metal brushed | 0 | Color E6 | High-sat cool | 0 |
| Material D7 | Transparent clear | 1 | Color E7 | Low-sat cool | 0 |
| Material D8 | Transparent frosted | 1 | — | — | — |
When evaluating a potential design, I sum the scores of its constituent features. A total score of 15 or above on the 0–20 scale indicates a high-affinity humanoid robot. This scoring mechanism enables fast, objective comparisons of different concepts, whether they are hand-drawn sketches or AI-generated images.
7. Training the Stable Diffusion Model for Affinity Generation
With the affinity scoring table in hand, I proceeded to train a stable diffusion (SD) model to generate humanoid robot appearances that would consistently achieve high affinity scores. The key challenge is that an untrained SD model, when given a prompt like “a friendly humanoid robot,” may produce arbitrary results that ignore the nuanced design features identified in my user study. Therefore, I adopted the Dreambooth methodology to fine-tune the entire SD model, and additionally trained LoRA modules to introduce stylistic variations.
7.1 Training Sample Selection and Editing
I collected a set of base humanoid robot images from various sources, including 3D renders and digital art. I then filtered this set according to the affinity scoring table, keeping only those images that contained at least one high-scoring feature in each category. To maximize the model’s learning efficiency, I ensured that the training set had a consistent overall style while still exhibiting diversity in specific design details. Using Photoshop and the ControlNet module within SD, I iteratively edited the selected images to align them more closely with the desired affinity features. For example, I replaced angular head shapes with horizontal rounded rectangles, changed square eyes to vertical rounded rectangles, adjusted the body proportions to resemble a slender adolescent build, and recolored the robot to use low-saturation warm colors.
Table 8 shows an example of how the affinity scores of training images evolved across three rounds of iterative refinement.
| Round | Head Shape | Eye Shape | Body Proportion | Material | Overall Color | Total Score |
|---|---|---|---|---|---|---|
| 1 | A4 (3) | B2 (1) | C3 (4) | D1 (1) | E1 (4) | 13 |
| 2 | A4 (3) | B3 (3) | C1 (3) | D2 (2) | E5 (3) | 14 |
| 3 | A4 (3) | B3 (3) | C3 (4) | D2 (2) | E1 (4) | 16 |
The refinement process significantly improved the training set quality, ensuring that the model learned from images that already embodied the highest degree of affinity.
7.2 Sample Annotation
After automatic captioning, I manually revised all annotations to precisely describe the affinity-related design features. Each image was annotated with a prompt that included the overall description (e.g., “affinity robot, minimalism, organic form, science fiction, humanoid robot”) and the specific feature tags (e.g., “oval head, vertical eyes, yellow eyes, no mouth, white body, plastic material, matte surface, teenage figure, full body, standing, arms at sides”). This detailed annotation ensures that the model associates the right textual descriptions with the exact visual features that drive affinity.
7.3 Training Parameters and Iterations
I used the following training configuration for the Dreambooth model:
| Parameter | Value | Parameter | Value |
|---|---|---|---|
| Learning Rate | 1×10⁻⁴ | Optimizer | 8bit-Adam |
| Iteration | 10 | Scheduler | Cosine |
| Batch Size | 5 | DIM | 128 |
| Epoch | 10 | Alpha | 64 |
The training loss was monitored after each epoch. I observed that the loss decreased from an initial high value to a minimum around epoch 7–9 (approximately 0.08), then started to increase slightly due to overfitting. This U-shaped loss curve is typical and indicates a good point for early stopping. The final model was selected based on both the loss trend and the qualitative evaluation of generated images.
7.4 Model Selection via XY Cross-Validation
To evaluate the combined effect of training epoch and model weight, I generated an XY cross grid. The X-axis represented different model weights (0.2, 0.4, 0.6, 0.8, 1.0), and the Y-axis represented epochs 3, 6, and 9. The resulting grid images were scored using the affinity scoring table. Table 10 summarizes the affinity scores for each configuration.
| Epoch | Loss Value | Weight 0.2 | Weight 0.4 | Weight 0.6 | Weight 0.8 | Weight 1.0 |
|---|---|---|---|---|---|---|
| 3 | 0.089 | 9 | 13 | 13 | 13 | 13 |
| 6 | 0.075 | 9 | 9 | 14 | 14 | 13 |
| 9 | 0.068 | 9 | 11 | 12 | 12 | 12 |
The highest affinity score (14) was achieved at epoch 6 with a weight of 0.6–0.8. Beyond that weight, the model tended to overfit to the training images and lost some generalization ability. Therefore, I selected the epoch-6 checkpoint with weight 0.7 as my primary generation model.
8. Generating a Style Matrix for Diverse High-Affinity Designs
Affinity is not a one-size-fits-all property. A humanoid robot that is perfect for a children’s hospital may need a different style than one designed for a corporate reception. To accommodate such variety, I combined the trained Dreambooth model with multiple LoRA style modules, each learned from a small set of curated images with a particular aesthetic (e.g., minimalist, cute-cartoon, sci-fi realistic, warm organic). By adjusting the weights of the LoRA modules, I could generate a wide range of scenes while maintaining the core affinity features.
Figure 1 (placeholder) illustrates a typical style matrix generated by this approach. Each row represents a different style, and each column represents a different random seed. The generated images were all evaluated with the affinity scoring table. A surprising finding was that some style variations (e.g., a more cartoonish style) could achieve equally high affinity scores as a more realistic style, as long as the key design features—rounded head, vertical eyes, slender child-like body, soft materials, and low-saturation warm or neutral colors—were preserved.
Table 11 provides affinity scores for five styles and five seeds each. Style 2 consistently produced high affinity scores across all seeds, demonstrating that the underlying SD model had successfully internalized the affinity design language.
| Style No. | Seed 1 | Seed 2 | Seed 3 | Seed 4 | Seed 5 |
|---|---|---|---|---|---|
| 1 | 15 | 12 | 10 | 9 | 8 |
| 2 | 15 | 14 | 14 | 14 | 14 |
| 3 | 15 | 14 | 14 | 12 | 12 |
| 4 | 14 | 12 | 12 | 9 | 9 |
This ability to generate a rich matrix of high-affinity design candidates in a matter of minutes is a major breakthrough for the design process. Instead of spending weeks sketching and revising concepts, designers can now use the AI system to produce a diverse array of options, narrow them down quickly using the affinity scoring table, and then focus their creative efforts on the most promising directions.
9. Mathematical Formulation of the Affinity Score
To provide a more formal representation, I define an affinity score function $$S$$ for a given humanoid robot design $$D$$ as the sum of the scores of its individual features:
$$
S(D) = \sum_{i=1}^{5} w_i \cdot s(f_i)
$$
where $$f_i$$ represents the design feature category (head shape, eye shape, body proportion, material, and color), $$s(f_i)$$ is the affinity score of the selected feature from Table 7, and $$w_i$$ is an optional weight that can be adjusted to reflect different user group priorities. In my default setting, all weights were equal to 1. For more advanced applications, I could assign different weights based on the target user’s age, culture, or context. For instance, in a pediatric context, I might increase the weight of liveliness; in a professional office context, gentleness might be weighted more heavily.
The trained stable diffusion model can be viewed as an implicit function that maps a prompt $$p$$ and a random noise vector $$z$$ to an image:
$$
I = \mathcal{G}_{\theta}(p, z)
$$
where $$\theta$$ represents all model parameters fine-tuned during Dreambooth and LoRA training. The goal of my training process was to maximize the expected affinity score of the generated image across the prompt distribution:
$$
\max_{\theta} \; \mathbb{E}_{p, z} \Big[ S\big( \mathcal{G}_{\theta}(p, z) \big) \Big]
$$
Because the affinity score is a discrete, non-differentiable function, it cannot be directly used as a loss function in gradient-based optimization. Instead, I achieve this maximization indirectly by curating training samples that have high affinity scores, annotating them with detailed prompts, and then optimizing the standard denoising objective. The model learns to associate the textual description of affinity features with the corresponding visual patterns, thereby implicitly maximizing the affinity score during inference.
10. Discussion and Design Guidelines
My research provides several actionable insights for designers of humanoid robots. First, the head shape should be a horizontal rounded rectangle or a circle, avoiding vertical pill shapes or semicircles. Second, the eyes should be vertical rounded rectangles, as they evoke a friendly and attentive gaze. Third, the body proportion should resemble a slender adolescent or child, never a bulky adult. Fourth, materials should prioritize fabric, especially with a fluffy texture, and if plastic is used, it should have a matte finish. Metal surfaces should be avoided entirely or covered with fabric panels. Fifth, colors should be chosen from low-saturation warm tones such as pastel yellow or soft orange, with white as a safe neutral. High-saturation cool colors are the least favorable.
Interestingly, my results also indicate that while liveliness is generally correlated with affinity, an overemphasis on playfulness can backfire—especially for material surface and color saturation. A humanoid robot that looks too “cartoonish” may be perceived as less reliable or less capable, which reduces its overall appeal. Therefore, a balanced design should incorporate subtle liveliness cues without sacrificing the sense of warmth and gentleness.
The stable diffusion model trained in this study offers a powerful tool for exploring the design space. By feeding the model with prompts that include the high-scoring feature tags, designers can instantly generate a large number of concepts that all meet the affinity criteria. They can then apply the scoring table to filter the best candidates, or use the style matrix to spark new ideas. This workflow demonstrates the complementary roles of human creativity and AI-generated diversity: the AI handles the combinatorial explosion of possibilities, while the human designer makes the final aesthetic and contextual judgments.
11. Limitations and Future Work
Despite the promising results, I acknowledge several limitations. First, the questionnaire participants were mostly from a single cultural background. Perceptions of a humanoid robot’s affinity can vary significantly across cultures. For example, the vertical eye shape might carry different connotations in East Asian vs. Western contexts. Future studies should collect data from multiple countries and ethnic groups to build a more universal affinity scoring table. Second, my design elements were presented as abstract 2D stimuli. The actual three-dimensional geometry, surface reflectance, and lighting conditions may alter the perceived affinity. Validation with physical or high-fidelity 3D-printed prototypes is necessary. Third, the current model generates static images. Humanoid robots are dynamic platforms; their expressiveness during movement, gesture, and conversation may override or modulate the effects of static appearance. Integrating the affinity design features with expressive behaviors (e.g., smooth motion, gentle voice, empathetic facial expressions) would provide a more holistic design solution.
Another important direction is the adaptation of the model to different application scenarios. A therapeutic humanoid robot for elderly care might prioritize gentleness, while a robot for children’s education might prioritize liveliness. The weight vector $$w_i$$ in my affinity score function can be customized to incorporate these context-specific priorities. I plan to train multiple LoRA modules, each optimized for a different target persona, so that designers can select the most suitable style with a single click.
Finally, I hope to integrate the affinity scoring table into a real-time evaluation loop during AI generation. Instead of post-hoc scoring, a reinforcement learning agent could use the scoring function as a reward signal to iteratively optimize the generated prompts or the latent vectors. This would create a fully automated design agent that continuously refines its outputs to maximize the affinity of each generated humanoid robot.
12. Conclusion
In this article, I have presented a systematic approach to designing humanoid robots with high perceived affinity, combining quantitative kansei engineering with state-of-the-art stable diffusion model training. I derived a comprehensive affinity scoring table from a large-scale user study, which was then used to curate and annotate training data. The trained model not only generates diverse, aesthetically pleasing humanoid robot concepts but also ensures that they adhere to evidence-based principles of affective design. This method significantly improves the efficiency and quality of the design process, providing a practical toolkit for robotic designers who wish to create approachable, trustworthy, and likable humanoid robots. As humanoid robots become more integrated into our daily lives, the ability to engineer emotional resonance will become as important as engineering functional capability. My work is a step toward that future, where robots are not only useful but also genuinely welcome companions in human society.