
The performance and reliability of industrial robots are fundamentally dependent on the precision and durability of their core drivetrain components. Among these, the RV reducer stands out as a critical element, providing the high torque, compact size, and exceptional positional accuracy required for demanding robotic tasks. The RV reducer’s mechanical characteristics directly influence the robot’s load capacity, dynamic response, and long-term operational stability. This article presents a comprehensive study on a key mechanical parameter: the end-face stiffness of the RV reducer. Based on specific testing requirements, we detail the measurement and calculation methodology, describe the development of a dedicated test apparatus, and present comparative test results for domestic and imported RV reducer units. The findings provide essential technical data to support the design optimization and performance evaluation of RV reducers.
The term “RV” stands for Rotary Vector, a传动 mechanism that evolved from traditional cycloidal drives. The RV reducer overcomes several limitations of its predecessors, offering superior advantages such as high reduction ratios in a compact package, excellent torque-to-weight ratio, high torsional stiffness, minimal backlash, and remarkable longevity. These attributes make the RV reducer the preferred choice for precision applications in industrial automation, articulated robot arms, and other high-accuracy, heavy-load scenarios.
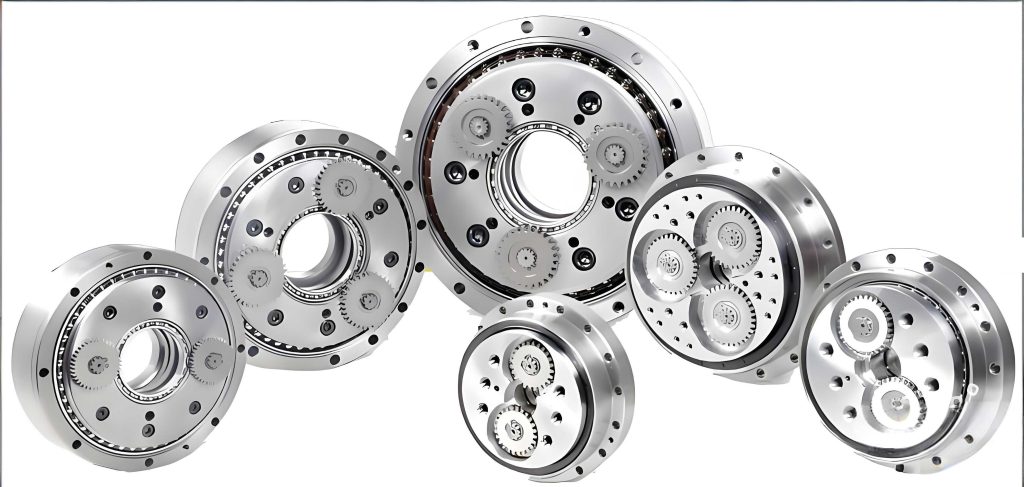
While torsional stiffness is often discussed, the end-face (or axial tilt) stiffness of an RV reducer is equally crucial. This parameter characterizes the resistance of the output flange to angular deflection under an applied overturning moment. In a robot joint, such moments arise from off-center loads and dynamic forces. A low end-face stiffness leads to excessive tilt of the output member, which can:
- Compromise positioning accuracy by introducing angular errors at the end-effector.
- Induce unwanted vibrations and reduce operational smoothness.
- Accelerate wear in downstream components like bearings and gears.
- Limit the effective load-carrying capacity of the robot arm.
Therefore, quantifying the end-face stiffness is vital not only for component selection but also as a key metric for guiding the design and manufacturing process of the RV reducer itself.
Structural Overview of the RV Reducer
The RV reducer features a two-stage, crank-based closed differential gear train. The first stage is typically a standard involute planetary gear set, which provides an initial speed reduction. The second, and most distinctive, stage is a cycloidal pin-wheel mechanism. This design is responsible for the reducer’s high reduction ratio and compactness. Common configurations include the E-series and C-series. The E-series, which is the focus of this study, incorporates a built-in main bearing structure. This integrated design reduces the part count, simplifies assembly, enhances structural reliability, and improves the unit’s capacity to handle external radial and axial loads directly on the output flange.
Principles and Methodology for End-Face Stiffness Measurement
Testing Principle
The core principle for measuring the end-face stiffness of an E-series RV reducer involves applying a known overturning moment to its output flange and precisely measuring the resulting angular tilt. A custom measurement plate is rigidly attached to the output flange of the RV reducer. A controlled force (W) is applied at a known, fixed distance (L) from the central axis of the RV reducer, generating an overturning moment (M = W × L). This moment causes the output flange to tilt by a small angle (θ).
The linear displacement (y) due to this tilt is measured at a specific radius (R) from the center using high-precision dial indicators or non-contact displacement sensors. The relationship between the linear displacement and the angular tilt is given by the small-angle approximation:
$$ \theta \text{ (in radians)} \approx \frac{y}{R} $$
Calculation of End-Face Stiffness
The end-face stiffness (k) is defined as the ratio of the applied overturning moment (M) to the resulting angular tilt (θ):
$$ k = \frac{M}{\theta} = \frac{W \cdot L}{\theta} $$
In practical engineering, angular tilt is often measured in arc-minutes. Converting from radians to arc-minutes (1 radian = (180/π) × 60 arc-minutes) leads to the following working formula:
$$ k = \frac{W \cdot L}{\theta} = \frac{W \cdot L}{ \frac{y}{R} } \times \frac{180}{\pi} \times 60 $$
Simplifying the constants yields a convenient formula for direct calculation:
$$ k = \frac{10800}{\pi} \cdot \frac{W \cdot L \cdot R}{y} \approx 3437.75 \cdot \frac{W \cdot L \cdot R}{y} $$
Where:
- k is the end-face stiffness (N·m/arc-min).
- W is the applied load force (N).
- L is the moment arm from the RV reducer axis to the load point (m).
- R is the measurement radius from the RV reducer center to the dial indicator (mm).
- y is the measured linear displacement at radius R (μm).
Design and Development of the Test Apparatus
A specialized test rig was designed and constructed to implement the described measurement principle accurately and repeatably. The apparatus ensures stable mounting of the RV reducer and precise application and measurement of forces and displacements.
The main components of the test apparatus include:
- Base Frame & Mounting Platform: A rigid, vibration-damped steel structure to securely hold the RV reducer housing via bolted fixtures.
- Loading Mechanism: A pneumatic cylinder system provides a smooth, controllable force. A servo-electric actuator could also be used for more programmable loading profiles.
- Force Measurement: A high-accuracy load cell (force sensor) is placed in line with the cylinder rod to measure the applied force (W) in real-time.
- Moment Arm Assembly: A rigid lever arm of precisely known length (L) connects the load cell to the measurement plate on the RV reducer output flange.
- Displacement Measurement System: Two high-precision digital dial indicators (or laser displacement sensors) are mounted 180 degrees apart at a fixed radius (R) on the measurement plate. Measuring at two opposing points helps average out any potential non-uniform tilt and compensates for minor rigid-body shifts.
- Data Acquisition System: A computer interfaces with the load cell and displacement sensors to record synchronized data of force and displacement during loading and unloading cycles.
The test procedure involves incrementally applying the overturning moment up to the rated value for the RV reducer, holding, and then incrementally unloading, while continuously recording the corresponding displacement values.
Data Acquisition, Processing, and Analysis
Data Characteristics and Curve Fitting
The raw data from the test generates a plot of Applied Moment (M) versus Angular Tilt (θ). This plot, known as the stiffness curve, is typically non-linear and exhibits hysteresis due to internal friction, preload in bearings, and micro-deflections within the RV reducer’s components (gears, pins, crankshaft). A representative, idealized stiffness curve is shown below.
The end-face stiffness value (k) is not a single number but is derived from the slope of this curve. Several methods exist to determine a representative stiffness value from such hysteresis loops:
| Method | Description | Advantage | Disadvantage |
|---|---|---|---|
| Two-Point Method | Uses the slope between the start (0,0) and the point at rated load. | Simple, fast. | Ignores non-linearity and hysteresis; often overestimates stiffness. |
| Endpoint Secant Method | Uses the slope between the points at minimum and maximum load on the loading curve. | Slightly more representative than the two-point method. | Still sensitive to initial settlement and final deflection points. |
| Average Slope Method | Divides the loading curve into several segments (e.g., 3), calculates the slope for each, and averages them. | Better reflects the overall behavior of the curve; reduces error from local non-linearities. | Requires more data processing. |
| Linear Regression | Fits a straight line through the central, more linear portion of the loading data (e.g., from 20% to 80% of max load). | Statistically robust; minimizes the influence of noise and initial settlement. | Requires defining the valid linear range subjectively. |
For this study, the Average Slope Method was employed to process the test data, as it provides a balanced and representative value of the RV reducer’s end-face stiffness under operational conditions.
Comparative Testing: Domestic vs. Imported RV Reducer
To validate the test apparatus and provide a practical performance benchmark, a comparative test was conducted between a domestic model and a widely recognized imported model of the same specification (RV-40E). Both RV reducers were subjected to identical test conditions, mounting procedures, and loading cycles. The processed data for both units is summarized in the table below.
| Parameter | Imported RV-40E Reducer | Domestic RV-40E Reducer | Performance Gap |
|---|---|---|---|
| Calculated End-Face Stiffness (k) | 881.2 N·m/arc-min | 683.6 N·m/arc-min | – |
| Relative Stiffness | 100% (Baseline) | 77.6% of Imported | -22.4% |
| Implied Angular Tilt at Rated Moment* | θimp = Mrated / 881.2 | θdom = Mrated / 683.6 | θdom ≈ 1.29 × θimp (29% larger tilt) |
Analysis of Results
The test results clearly indicate a significant difference in end-face stiffness between the two tested RV reducers. The domestic RV reducer exhibited approximately 22.4% lower stiffness than its imported counterpart. This has direct engineering implications:
- Reduced Load Capacity: For a maximum permissible angular tilt (deflection) defined by the robot’s accuracy requirements, the domestic RV reducer will reach this limit at a lower applied moment. This effectively reduces the operational load capacity of the robot joint.
- Dynamic Performance: Lower stiffness correlates with a lower natural frequency of the mechanical structure. This can make the robot arm more susceptible to vibrations during high-speed movements or when encountering external disturbances, potentially affecting settling time and path tracking accuracy.
- Design Insights: The disparity suggests potential areas for improvement in the domestic RV reducer’s design and manufacturing, such as:
- Bearing selection and preload optimization within the RV reducer.
- Stiffness of the output flange and its connection to the cycloidal disk assembly.
- Material properties and heat treatment of critical components.
- Tolerances and fits affecting the overall structural integrity of the assembly.
The relationship between component dimensions, material properties, and the overall end-face stiffness can be modeled for design purposes. A simplified analytical model considering the output flange as a circular plate supported at its inner radius (by the main bearing) and subjected to a moment can provide insight. The maximum tilt (θ) is proportional to the applied moment (M) and inversely proportional to the flexural rigidity (D) of the plate:
$$ \theta \propto \frac{M \cdot a}{D} $$
where \( a \) is a geometric factor and \( D = \frac{E t^3}{12(1-\nu^2)} \), with E being Young’s modulus, t the effective thickness, and ν Poisson’s ratio. This highlights that stiffness scales with the cube of thickness and linearly with elastic modulus, guiding material and geometry choices.
Conclusion and Future Perspectives
This study successfully detailed a methodology and implemented a functional test apparatus for the critical evaluation of end-face stiffness in RV reducers. The developed rig fulfills a need for specialized testing equipment in this domain. The proposed calculation formula provides a straightforward and practical tool for engineers. The comparative testing between domestic and imported RV reducers yielded quantifiable data, revealing a measurable gap in mechanical performance related to load-induced deflection.
The findings underscore that end-face stiffness is a paramount specification for high-performance RV reducers. For the advancement of domestic RV reducer technology, focused efforts should target:
- Integrated Design Analysis: Employing Finite Element Analysis (FEA) to simulate the end-face stiffness during the design phase, optimizing the geometry of the housing, output flange, and internal support structures.
- Advanced Manufacturing & Assembly: Implementing tighter tolerances, superior bearing preload control, and advanced surface treatments to enhance the contact stiffness of internal interfaces.
- Material Science: Exploring the use of higher-strength alloys or localized hardening techniques for critical load-bearing components within the RV reducer.
- Standardized Testing Protocols: Establishing industry-wide standards for measuring and reporting end-face stiffness, torsional stiffness, and other dynamic parameters of RV reducers to facilitate fair comparison and reliable integration into robotic systems.
In conclusion, the end-face stiffness of an RV reducer is a vital indicator of its quality and suitability for precision robotic applications. The experimental approach and results presented herein provide a valuable framework and reference data for manufacturers aiming to characterize, improve, and validate the performance of their RV reducer designs, ultimately contributing to the development of more capable and reliable industrial robots.