
In the field of industrial robotics, achieving high positional accuracy and repeatability is paramount. This performance is critically dependent on the precision of the joint actuators, where the RV (Rotate-Vector) reducer plays a central role. The RV reducer is a sophisticated two-stage speed reduction mechanism combining a first-stage involute planetary gear train with a second-stage cycloidal pin-wheel drive. Its compactness, high torque capacity, and high reduction ratios make it indispensable. However, a key performance metric that directly impacts the robot’s precision is backlash—the lost motion or angular lag experienced at the output shaft when the input direction is reversed. Excessive backlash leads to positioning errors, vibration, and reduced control stability. Therefore, minimizing backlash is a fundamental objective in the design of high-performance RV reducers.
Backlash in gear systems arises from various sources, including geometric clearance from manufacturing tolerances and assembly fits, elastic deformation under load, and thermal expansion. For the purpose of initial design and tolerance allocation, the geometric backlash is the primary focus. It represents the inherent clearance built into the system due to the physical dimensions and tolerances of components before any operational loads are applied. This work focuses on the modeling, analysis, and robust optimization of this geometric backlash in RV reducers.
The primary contributions of this work are the derivation of a comprehensive mathematical model for the geometric backlash of an RV reducer, incorporating errors from both the involute and cycloidal stages, and the application of a Taguchi-style robust design methodology. Robust design aims to make the product’s performance (in this case, low backlash) insensitive, or “robust,” to the unavoidable variations in noise factors (manufacturing and assembly errors) by optimally setting the control factors (key design parameters). We first perform a sensitivity analysis to identify the most critical error sources. Subsequently, we employ Design of Experiments (DOE), specifically orthogonal arrays, to find the optimal combination of control factor levels that minimizes the mean backlash while also minimizing its variation due to noise, thus achieving a robust optimal design.
Geometric Backlash Modeling in the RV Reducer
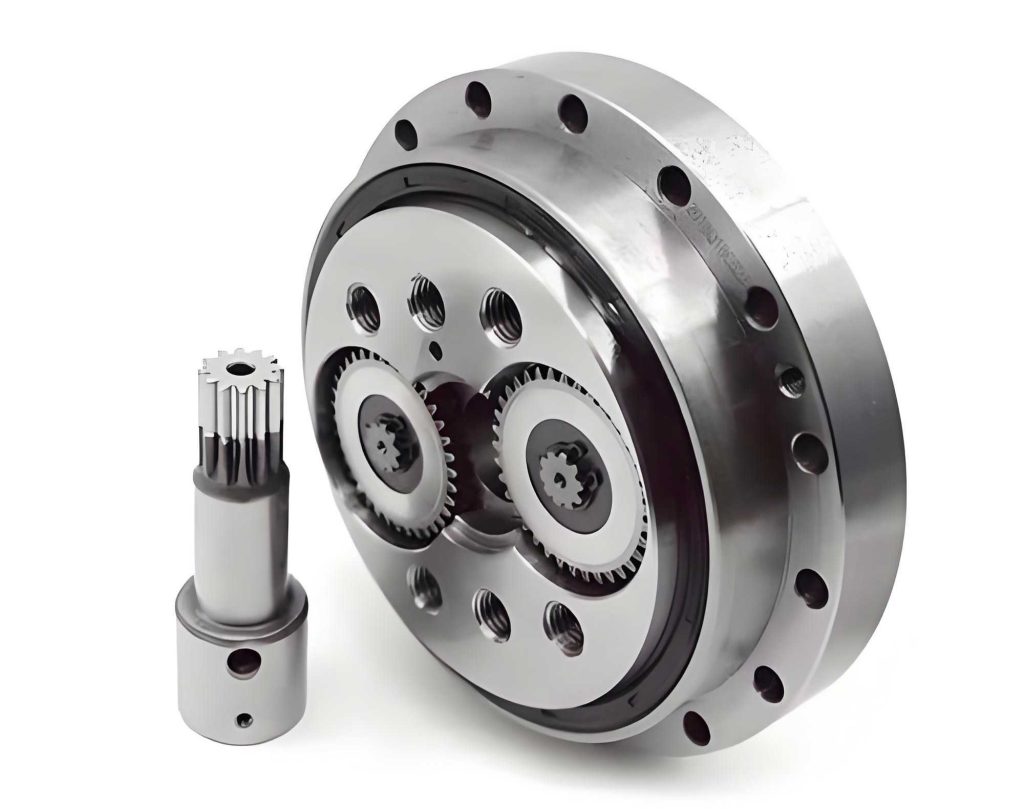
To analyze the geometric backlash, we must systematically account for all potential sources of clearance within the RV reducer’s kinematic chain. The mechanism can be conceptually divided into two main subsystems: the involute planetary stage and the cycloidal pin-wheel stage. A typical RV reducer structure is illustrated below, showing the integration of these stages.
The total angular geometric backlash at the output shaft (often the crankshaft or the planet carrier), denoted as $\phi$ (in arc-minutes), is the superposition of contributions from each independent error source. The general form of the equation, considering the transmission ratio, is:
$$ \phi = \frac{180 \times 60}{i \pi r_1} \sum_{k=1}^{4} J_{E_k} + \frac{180 \times 60}{\pi} \sum_{j=1}^{8} \phi_j $$
where $i$ is the total reduction ratio, $r_1$ is the pitch radius of the sun gear, $J_{E_k}$ are the backlash contributions from the involute gear stage, and $\phi_j$ are the backlash contributions from the cycloidal stage.
Error Sources and Their Mathematical Formulation
1. Involute Planetary Stage Errors:
This stage’s backlash is primarily influenced by gear manufacturing quality and assembly. The key factors considered are:
- Average Base Tangent Length Deviation ($E_w$): Affects the tooth thickness and thus the meshing clearance.
- Center Distance Error ($\Delta F_a$): The deviation from the nominal distance between the sun and planet gear axes.
- Radial Runout Error of the Gear ($\Delta F_t$): Causes periodic variation in the effective center distance.
The combined backlash from this stage at the input side must be reflected to the output, accounting for the first-stage reduction ratio.
2. Cycloidal Pin-Wheel Stage Errors:
This stage is more complex and contributes significantly to the total backlash. The critical factors include:
- Profile Modifications: These are intentional design parameters to ensure proper lubrication and load distribution, but they directly create clearance.
- Equidistant Modification ($\Delta r_{rp}$): A uniform reduction of the cycloid wheel tooth profile radius.
- Offset Modification ($\Delta r_p$): A shift of the generating point for the cycloid profile.
- Manufacturing Tolerances:
- Needle Pin Center Circle Radius Error ($\delta r_p$).
- Needle Pin Radius Error ($\delta r_{tp}$).
- Circumferential Position Error of Needle Pin Holes ($\delta t$).
- Total Cumulative Pitch Error of the Cycloid Wheel ($\Delta F_p$).
- Radial Runout of the Cycloid Wheel ($\Delta F_{t1}$).
- Assembly Fits and Errors:
- Clearance between Needle Pins and their Holes ($\delta J$).
- Eccentricity Error of the Crankshaft ($\delta d$).
- Clearance in the Crankshaft Bearings (e.g., Cycloidal Bearings) ($\Delta u$).
- Tolerances on Modifications:
- Errors in achieving the intended equidistant ($\delta\Delta r_{rp}$) and offset ($\delta\Delta r_p$) modifications.
The mathematical model derives specific conversion formulas that translate each of these linear or angular errors into an equivalent angular backlash at the output shaft. The sensitivity of the total backlash to each parameter varies significantly. To facilitate rapid calculation and analysis, the derived model was implemented in a dedicated software tool. This tool allows designers to input the basic RV reducer parameters and tolerance values for all error sources and instantly compute the individual and total geometric backlash.
Sensitivity Analysis of Backlash Contributors
Not all error sources affect the final backlash equally. A sensitivity analysis is crucial to identify which parameters require stricter control during manufacturing and which ones have a lesser impact, allowing for potential cost savings on tolerances. We employ the concept of relative sensitivity $RS_i$ to compare the influence of different factors. It is defined as $RS_i = S_i / S_0$, where $S_i$ is the absolute sensitivity (partial derivative of backlash with respect to the parameter), and $S_0$ is a benchmark sensitivity, chosen here as the sensitivity to the equidistant modification $\Delta r_{rp}$ ($S_0 = 1$).
The analysis was performed for a representative RV reducer model, RV-80E. Its basic design parameters are listed in the table below.
| Parameter | Symbol | Value |
|---|---|---|
| Eccentricity | $e$ | 2.2 mm |
| Number of Cycloid Wheel Teeth | $z_g$ | 39 |
| Total Reduction Ratio | $i$ | 121 |
| Short Width Coefficient | $K_1$ | 0.73 |
| Pressure Angle (Involute) | $\alpha$ | 20° |
| Sun Gear Teeth | $z_1$ | 21 |
| Planet Gear Teeth | $z_2$ | 42 |
| Module | $m$ | 2 mm |
The calculated relative sensitivities for the major error sources are summarized in the following table. The sign indicates the direction of the effect (positive: increasing the error increases backlash; negative: increasing the error decreases backlash, though in practice errors can be positive or negative).
| Error Factor | Relative Sensitivity $RS_i$ | Mathematical Expression (Approx.) |
|---|---|---|
| Equidistant Modification $\Delta r_{rp}$ | 1.00 (Benchmark) | 1 |
| Needle Pin Radius Error $\delta r_{tp}$ | -1.00 | -1 |
| Offset Modification $\Delta r_p$ | -0.68 | $-\sqrt{1-K_1^2}$ |
| Needle Pin Center Circle Radius Error $\delta r_p$ | 0.68 | $\sqrt{1-K_1^2}$ |
| Circum. Position Error of Pin Holes $\delta t$ | 0.73 | $K_1$ |
| Clearance: Pin/Pin Hole $\delta J$ | 0.50 | $1/2$ |
| Crankshaft Bearing Clearance $\Delta u$ | -0.667 | $-\frac{e z_g}{2 e}$* |
| Error in Offset Modification $\delta\Delta r_p$ | -0.68 | $-\sqrt{1-K_1^2}$ |
| Total Pitch Error $\Delta F_p$ | -0.365 | $-K_1/2$ |
| Error in Equidistant Modification $\delta\Delta r_{rp}$ | 1.00 | 1 |
| Radial Runout of Cycloid Wheel $\Delta F_{t1}$ | 0.25 | $1/4$ |
| Average Base Tangent Length Dev. $E_w$ | -0.03 | $\frac{-e z_g}{4 i r_1 \cos\alpha}$ |
* Note: The simplification $-\frac{e z_g}{2 e} = -z_g/2$ is context-dependent; the original form is kept as derived.
Key Insight from Sensitivity Analysis: The parameters with the largest magnitude of relative sensitivity ($|\ RS_i\ | \approx 1$) are $\Delta r_{rp}$, $\delta r_{tp}$, $\delta\Delta r_{rp}$, $\Delta r_p$, and $\delta r_p$. This indicates that the intentional profile modifications ($\Delta r_{rp}, \Delta r_p$) and the machining accuracy of the needle pins and their locating circle ($\delta r_{tp}, \delta r_p$) are the most dominant factors determining the geometric backlash of the RV reducer. These must be controlled with high precision. In contrast, errors in the involute stage ($E_w$) show very low sensitivity for this high-ratio RV reducer.
Robust Design Optimization Using Orthogonal Arrays
The goal of robust design is not merely to find a nominal design with low backlash, but to find a design that maintains consistently low backlash even when the numerous “noise factors” (manufacturing errors) vary within their expected tolerances. We frame this as an optimization problem using the Taguchi method.
1. Selection of Control and Noise Factors
We select key design parameters that can be precisely controlled during the design phase as Control Factors. Based on the sensitivity analysis, we choose four critical ones. All other manufacturing and assembly errors are treated as uncontrollable Noise Factors.
| Control Factor | Symbol |
|---|---|
| A: Eccentricity | $e$ |
| B: Needle Pin Center Circle Radius | $r_p$ |
| C: Equidistant Modification Amount | $\Delta r_{rp}$ |
| D: Offset Modification Amount | $\Delta r_p$ |
The 13 major noise factors from the model (e.g., $\delta r_{tp}$, $\delta t$, $\delta J$, $\Delta u$, etc.) are considered.
2. Orthogonal Experimental Design
Each control factor is assigned three levels (Level 1, 2, 3), typically set around the nominal value considering a feasible design range. Similarly, each noise factor is assigned three levels representing the lower limit, nominal, and upper limit of its expected tolerance range. The specific level values are determined based on standard tolerance grades and process capabilities.
| Level | Factor A: $e$ | Factor B: $r_p$ | Factor C: $\Delta r_{rp}$ | Factor D: $\Delta r_p$ |
|---|---|---|---|---|
| 1 | 2.198 | 114.975 | -0.054 | -0.054 |
| 2 | 2.200 | 115.000 | -0.050 | -0.050 |
| 3 | 2.202 | 115.025 | -0.046 | -0.046 |
A two-step orthogonal array approach is used:
- Inner Array (Control Array): An $L_9(3^4)$ array is used to define 9 distinct experimental runs for the 4 control factors at 3 levels each. This array efficiently samples the control factor space.
- Outer Array (Noise Array): An $L_{27}(3^{13})$ array is used to define 27 distinct combinations of the 13 noise factors at their 3 levels. This simulates the varying conditions of manufacturing and assembly.
The complete experiment thus consists of $9 \times 27 = 243$ computational trials. For each of the 9 control factor combinations (from the inner array), we calculate the backlash 27 times (using the outer array), each time with a different set of noise factor values. This simulates how the backlash of each candidate design would vary in real-world production.
3. Analysis and Optimization using Signal-to-Noise Ratio
For each of the 9 design configurations (rows of the inner array), we have 27 calculated backlash values $\phi_{i,1}, \phi_{i,2}, …, \phi_{i,27}$. To assess both the mean performance and the variation (robustness), we calculate the Taguchi Signal-to-Noise Ratio (SNR) for the “smaller-the-better” characteristic. A higher SNR indicates a combination of smaller mean and lower variance.
$$ SNR_i = -10 \log_{10}\left( \frac{1}{27} \sum_{k=1}^{27} \phi_{i,k}^2 \right) $$
The inner array with the calculated mean backlash and SNR for each control factor combination is shown below.
| Exp. Run | A: $e$ | B: $r_p$ | C: $\Delta r_{rp}$ | D: $\Delta r_p$ | Mean Backlash $\bar{\phi}$ [arc-min] | SNR [dB] |
|---|---|---|---|---|---|---|
| 1 | 1 | 1 | 1 | 1 | 0.886 | 11.4798 |
| 2 | 1 | 2 | 2 | 2 | 1.316 | 7.5541 |
| 3 | 1 | 3 | 3 | 3 | 1.497 | 5.4622 |
| 4 | 2 | 1 | 2 | 3 | 1.495 | 5.4870 |
| 5 | 2 | 2 | 3 | 1 | 1.161 | 8.6583 |
| 6 | 2 | 3 | 1 | 2 | 1.314 | 7.5767 |
| 7 | 3 | 1 | 3 | 2 | 1.312 | 7.5997 |
| 8 | 3 | 2 | 1 | 3 | 1.493 | 5.5154 |
| 9 | 3 | 3 | 2 | 1 | 1.159 | 8.6851 |
Optimal Robust Solution: The design with the highest SNR is Experiment Run 1, with an SNR of 11.48 dB. This corresponds to the control factor combination A1B1C1D1 ($e=2.198$ mm, $r_p=114.975$ mm, $\Delta r_{rp}=-0.054$ mm, $\Delta r_p=-0.054$ mm). The mean backlash for this robust design is 0.886 arc-minutes.
Comparison with Conventional Design: A conventional or initial design might use the nominal mid-point values (A2B2C2D2). The analysis shows this design has a mean backlash of approximately 1.518 arc-minutes when subjected to the same noise variations. Therefore, the robust design optimization achieved a reduction in geometric backlash of about 41.6% while simultaneously improving consistency (higher SNR).
| Design | $e$ (mm) | $r_p$ (mm) | $\Delta r_{rp}$ (mm) | $\Delta r_p$ (mm) | Mean Backlash [arc-min] | SNR [dB] |
|---|---|---|---|---|---|---|
| Conventional (Nominal) | 2.200 | 115.000 | -0.050 | -0.050 | ~1.518 | ~7.2* |
| Robust Optimal | 2.198 | 114.975 | -0.054 | -0.054 | 0.886 | 11.48 |
* Estimated from adjacent experimental runs.
4. Analysis of Factor Effects
We can also analyze the inner array data to understand the main effect of each control factor on the mean backlash. By averaging the results for each level of a factor, we can see its influence.
| Factor | Level 1 Avg. | Level 2 Avg. | Level 3 Avg. | Range (Max-Min) |
|---|---|---|---|---|
| A: $e$ | 1.233 | 1.323 | 1.321 | 0.090 |
| B: $r_p$ | 1.231 | 1.323 | 1.323 | 0.092 |
| C: $\Delta r_{rp}$ | 1.231 | 1.323 | 1.323 | 0.092 |
| D: $\Delta r_p$ | 1.069 | 1.314 | 1.495 | 0.426 |
The range indicates the strength of the factor’s effect. Factor D ($\Delta r_p$) has the largest range (0.426), meaning the choice of its level has the most significant impact on the mean backlash value. This aligns with the high sensitivity identified earlier. The optimal levels for minimizing the mean, based on this simple averaging, would be A1, B1, C1, D1, which matches the robust optimal found via SNR.
A more rigorous Analysis of Variance (ANOVA) can quantify the percentage contribution of each control factor to the variation in the mean backlash. The results would clearly show that the modification amounts (Factors C and D) dominate the performance, guiding where to focus design precision.
Conclusion
This work presented a systematic methodology for the modeling and robust design optimization of geometric backlash in RV reducers. A comprehensive mathematical model was derived, incorporating critical manufacturing and assembly errors from both the involute and cycloidal stages of the RV reducer. Sensitivity analysis using this model for a standard RV reducer size revealed that the equidistant modification, needle pin radius error, and offset modification are the most influential parameters.
The core of the work applied the robust design philosophy. By classifying parameters into control and noise factors and employing a nested orthogonal experimental design ($L_9$ inner array $\times$ $L_{27}$ outer array), we simulated the performance of candidate designs under real-world variation. Optimization was conducted using the Signal-to-Noise Ratio as a robustness metric. The optimal combination of control factor levels was identified, resulting in a design with a calculated mean geometric backlash of 0.886 arc-minutes. This represents a 41.6% reduction compared to the backlash expected from a conventional nominal design, demonstrating a significant improvement in precision potential.
The methodology underscores a critical design insight: simply choosing nominal mid-point values for parameters like profile modifications does not yield the best performance. Instead, a deliberate, statistically guided selection that considers the system’s interaction with production variations is essential. This approach allows designers of RV reducers to proactively minimize backlash at the design stage, leading to inherently more precise and reliable robotic joints, while also providing guidance for rational tolerance allocation to control cost.